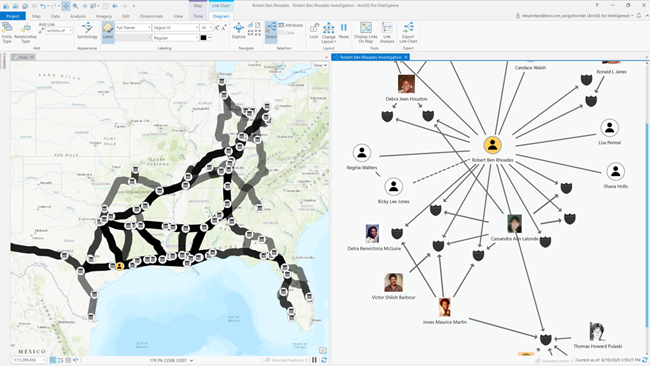
A link chart is a way to visualize relationships between entities in your data, and is a complementary view to the map. A link chart contains two main components: nodes and links. Nodes, which can be visualized as boxes with a symbol and a label inside, represent entities: any person, place, or thing. In the data, you can think of these entities as a row in a table. These entities have traditionally been displayed as point features on a map in ArcGIS. You can add collections of nodes to a link chart by adding one or more layers (which are listed in the Contents pane) to the chart as a entity type. Links are the lines that connect nodes in the chart and are the visual representation of a relationship. If a link connects two nodes, it is assumed that these nodes have a relationship of some kind. You can add a relationship type to automatically load links that match nodes together. You can also draw links manually between nodes.
