Available with Spatial Analyst license.
One of the most common applications of the Generalization tools is the process of cleaning up a classified image that was derived from remote-sensing software. The classification process often results in many isolated small zones of data that are either misclassified or irrelevant to the analysis.
Creating a generalized land-use map from a satellite image
The following example demonstrates a typical sequence of applying the generalization tools to produce a raster layer that is more suitable for presentation or subsequent analysis.
Each tool can be used alone or in combination with other data cleanup tools for various applications.
Starting with a raw satellite scene
The image below shows the raw satellite image that will be classified. While the classification process will not be explicitly described, the following section will detail some of the reasons that the direct result typically needs some further processing to be generally useful.
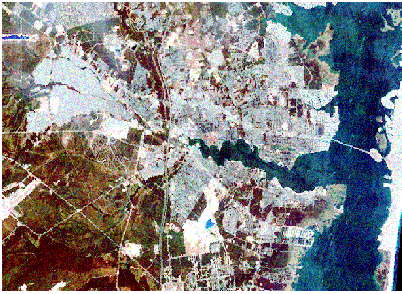
Image result after classification
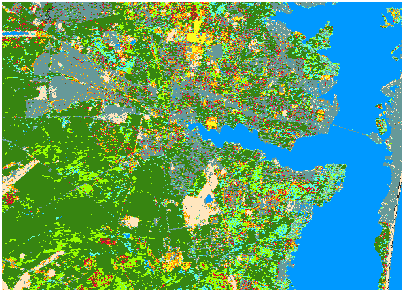
In a supervised classification, training samples are identified on an image, such as the satellite image. The training samples are taken in different land uses to identify water, residential, hardwoods, conifers, and so on. From these training samples, all other cell locations in the image are allocated to one of these known land types or uses. Sometimes land-use signatures (statistics derived from the training samples) are similar, making it difficult to distinguish between two classes. For example, with the existing training samples, the software may not be able to distinguish between an alder swamp and a wetland with hardwoods. This may be due to an inadequate number of training samples or the fact that certain land uses were never sampled at all. These limitations, as well as others, can lead to the misclassification of certain locations.
As a result, a single or a small group of cells may be misclassified as an entity different from the sea of cells surrounding it, when in reality, the entity belongs to the group of cells that surrounds it. Another typical area of misclassification is the boundaries between different land uses. Often, what results is a jagged, unrealistic representation of the boundary that can be smoothed with the generalization tools.
Below is the classification of the satellite image. Notice there are many small, isolated single cells or groups of cells throughout the image.
The following sections demonstrate how the generalization tools can be applied to produce a final classified raster.
Removing misclassified cells with Majority Filter
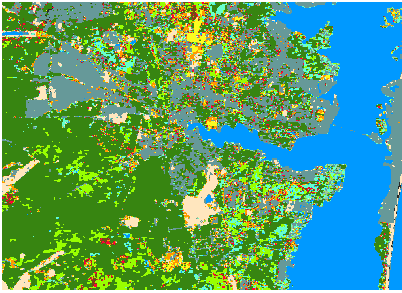
To remove the single, misclassified cells in the classified image, the Majority Filter tool is applied. The results are displayed in the image below. Notice that many of the smaller groups of cells have disappeared.
Smoothing zones with Boundary Clean
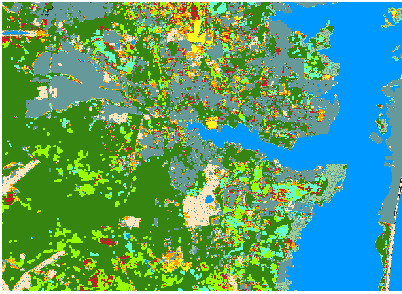
To smooth the boundaries between zones, the Boundary Clean tool can be implemented. By expanding and shrinking the boundaries, the larger zones will invade smaller zones, as is the case in the image below. Again, notice that even more of the smaller and thinner groups of cells have disappeared.
Identifying clusters with Region Group
The Majority Filter and Boundary Clean tools will only process out the single or very small clusters of a few misclassified cells by assigning them to the value that appears most frequently in the immediate neighborhood. Suppose, however, that there is a certain size threshold below which individual groupings of like cells are considered too small to be meaningful in the ensuing analysis. These clusters should instead be dissolved into the surrounding groups. For example, any contiguous clusters of the same land-use category that are smaller than 7,200 square meters in size are deemed not significant to the analysis. However, these isolated regions cannot be individually processed, since they have the same land-use value as the entire zone.
To resolve this issue, the Region Group tool is applied. This tool will assign a unique identifier to each region in the input raster (the classified image). A region is any contiguous group of cells of the same value. Consider a single zone composed of two regions that are not connected. Region Group will divide this zone into two new zones, each having a unique identification (zone) value. The original zone value is maintained as a LINK field in the output attribute table. The resulting raster is shown below and displays the many different output zones.
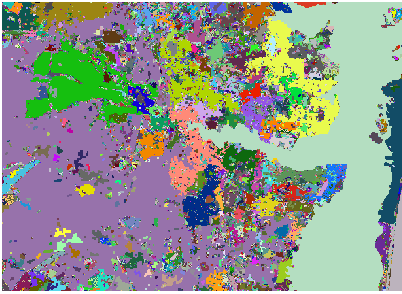
Remove areas smaller than threshold
Next, using a selection tool, such as the Extract by Attributes tool in the Extraction toolbox, an output raster is created where regions smaller than the area threshold have been removed.
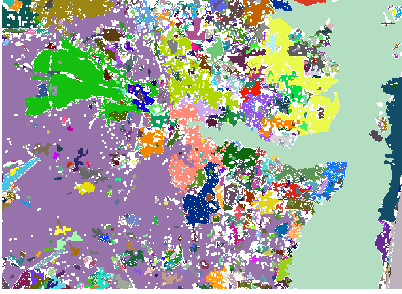
Eliminating small regions with Nibble
Using the Nibble tool on the resultant raster from the extraction tool (identifying the regions to eliminate) and with the values from the classified image raster, the tool visits each cell location to eliminate and replaces it with the closest cell with a value on the classified raster.
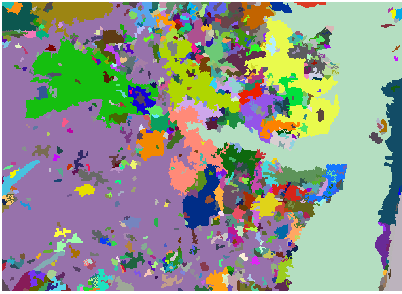
Final generalized land-use map
Using the link item from the results of the Region Group tool, the original zone values from the classified image are reassigned to the individual regions created from the Region Group tool.
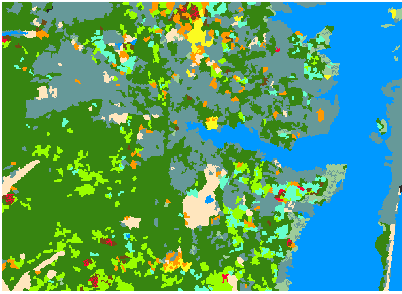
The result is a more generalized land-use map, which can be used in subsequent analyses.