Available with Network Analyst license.
In this exercise, you will find the best routes for a fleet of vehicles, operated by a distribution company, to deliver goods from a distribution center to a set of 25 grocery stores. Each store has a specific quantity of demand for the goods, and each truck has a limited capacity for carrying the goods. The main objective is to assign trucks in the fleet a subset of the stores to service and to sequence the deliveries in a way that minimizes the overall transportation costs.
This can be achieved by solving a vehicle routing problem (VRP). Once the delivery sequence is determined, you will generate the turn-by-turn directions for the resulting routes, which can be electronically distributed or printed and given to the drivers to make the deliveries.
Get the data
The data for this tutorial is available for download.
- Go to the data download page.
- Click the Download button, and save the file locally.
- Unzip the downloaded file.
Create a map
- Open ArcGIS Pro.
- Create a new project based on the Map.aptx template.
A new project with a map appears.
Add the tutorial data to the project
A network dataset is an intelligent model of the road system. It contains not only the location and attributes of roads but also information about how roads relate to one another, such as which roads are connected, which turns between connected roads are allowed or prohibited, and other information that affects what travel paths are possible and how long travel takes. The route solver references the network dataset to determine the shortest path between stops.
Note:
If you perform an analysis using ArcGIS Online, the solver references a high-quality, worldwide network dataset stored in the ArcGIS Online cloud and uses ArcGIS Online credits. You can also use your own network dataset stored locally on your machine or use ArcGIS Enterprise to publish routing services using your own network dataset and configure the services with your enterprise portal to consume them from ArcGIS Pro.In this set of steps, add a network dataset to the map.
- In the Catalog pane, which is on the side of the application by default, right-click Folders and choose Add Folder Connection
 .
.The Add Folder Connection dialog box appears.
- Browse to the folder where you placed the tutorial data, double-click Network Analyst, and click Tutorial to select the folder.
- Click OK.
A connection to the Tutorial folder is created.
- In the Catalog pane, expand Folders > Tutorial > SanFrancisco.gdb > Transportation.
- Drag Streets_ND, which has a network dataset icon
 , onto the map.
 The network dataset is added to the Contents pane as well as to the map.
- Right-click Streets_ND in the Contents pane and choose Zoom To Layer
 to view the San Francisco area.
By default, network datasets built with traffic data show traffic conditions for the current time when they are added to the map. This network dataset includes historical traffic, so you are seeing typical traffic conditions for the current time and day of the week. Not all roads in this network dataset include traffic, so only the ones that do are shown by default.
The area covered by the network dataset is where you can perform network analyses.
Viewing the network dataset isn't required to perform an analysis, so next, you will hide it.
- In the Contents pane, uncheck Streets_ND to display the basemap only.
- In the Catalog pane, browse to Tutorial > SanFrancisco.gdb > Analysis.
- In the Catalog pane, right-click the Stores layer and choose Add to Current Map
 .
.The Stores layer is added to the Contents pane and to the map.
- Repeat step 9 to add the DistributionCenter layer to the map.
Note:
You can also add a layer to the map by dragging it from the Catalog pane onto the map.
Next, add one of the network datasets contained within the folder to the map.
Create the Vehicle Routing Problem layer
A Vehicle Routing Problem (VRP) layer provides the structure and properties needed to set up and solve multiple vehicle routing problems. It also contains the results after solving.
- On the Analysis tab, in the Workflows group, click Network Analysis > Vehicle Routing Problem
 .
.The VRP layer is added to the Contents pane. It includes several sublayers that hold the inputs and outputs of the analysis.
This is referencing the San Francisco network dataset because the network was in the Contents pane when the VRP layer was created.
Note:
To see or change the network data source that is used to create the network analysis layer, on the Analysis tab, in the Workflows group, you can click the Network Analysis drop-down menu and look under Network Data Source.
- In the Contents pane, click Vehicle Routing Problem to select the group layer.
The Vehicle Routing Problem tab appears in the Network Analyst group at the top of ArcGIS Pro.
- Click VRP to see the tab's controls.

You'll use these controls to define the VRP model you want to generate.
Tip:
The VRP tab appears only when you select a VRP layer in the Contents pane. Also, if you have multiple VRP layers, you can change the settings of the layers individually or select the multiple layers to edit the settings for all the selected layers if they share the same network data source. present, each has its own tab.
Add orders
You will add the grocery store locations to the Orders network analysis class. You can think of orders as orders to be filled, since each grocery store has requested goods to be delivered to it from the distribution center. Members of the Orders class will eventually become stops along the vehicles' routes.
The grocery store locations are already added as a feature layer, Stores, in the map document. The attributes of the Stores contain information about the total weight of goods (in pounds) required at each store, the time window during which the delivery must be made, and the service time (in minutes) incurred while visiting a store. The service time is the time required to unload the goods.
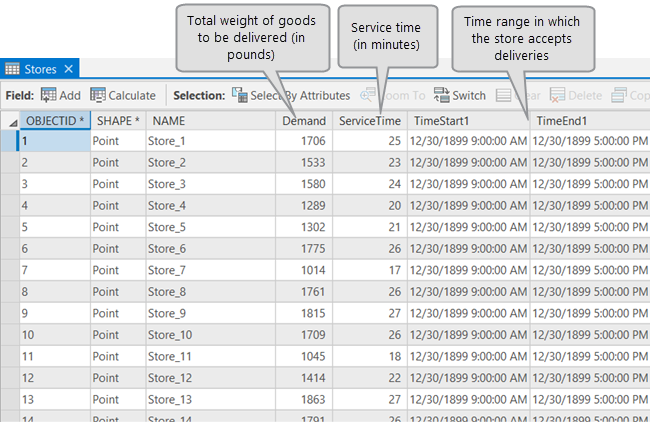
The table shows the date values of 12/30/1899. This is the date value used to indicate that only a time is being specified. When all time fields have this date associated with its time values the solver will use the default date to determine which date to use for the solve. In this case we will solve for a generic Monday and that will be used in each time field.
Learn more about time windows and how to specify dates
- On the VRP tab, in the Input Data group,
click Import Orders
 .
.The Add Locations window appears.
- Make sure Input Network Analysis Layer is set to Vehicle Routing Problem and Sub Layer is set to Orders.
- Click the drop-down arrow for Input Locations and choose Stores. This is the point feature class you previously added to the map.
- Under Field Mappings, choose Name from Property and make sure NAME is auto mapped in the Field Name parameter.
- Map the following fields if they are not auto mapped:
- TimeWindowStart > TimeStart1
- TimeWindowEnd > TimeEnd1
- DeliveryQuantity_1 > Demand
- Under Field Mappings, choose MaxViolationTime from Property and type 0 in the Default Value parameter.
This indicates that the location cannot be visited outside of its designated time window.
- Leave the default settings for the rest of the parameters and click the OK button.
A total of 25 stores are listed in the Orders' attribute table and displayed as orders on the map.
Add depots
The goods are delivered from a single distribution center whose location is shown in the DistributionCenter feature layer that was previously added to the map. The distribution center operates between 8:00 a.m. and 5:00 p.m.. You will add this point feature to the Depots network analysis class.
- On the VRP tab, in the Input Data group,
click Import Depots
 .
.The Add Locations window appears.
- Make sure Input Network Analysis Layer is set to Vehicle Routing Problem and Sub Layer is set to Depots.
- Click the drop-down arrow for Input Locations and choose DistributionCenter.
- Under Field Mappings, choose Name from Property and make sure NAME is auto mapped in the Field Name parameter.
- Under Field Mappings, choose TimeWindowStart from Property and type 8AM in the Default Value parameter.
- Under Field Mappings, choose TimeWindowEnd from Property and type 5PM in the Default Value parameter.
- Leave the default settings for the rest of the parameters and click the OK button.
One distribution center is listed in the Depots' attribute table and displayed as a Depot on the map.
Add routes
The distribution center has three trucks, each with a maximum capacity to carry 15,000 pounds of goods. You will add three routes (one for each vehicle) and set the properties for the routes based on the center's operational procedures.
- On the VRP tab, in the Input Data group, click the drop-down arrow for Import Routes and select Add Routes.
The Add Locations window appears.
- Make sure Input Vehicle Routing Problem Layer is set to Vehicle Routing Problem.
- For Number of Routes, enter 3.
- Change Route Name Prefix to Truck.
- From the Start Depot Name and End Depot Name drop-down options, select San Francisco.
- Change Earliest Start Time and Latest Start Time to 8:00:00 AM.
- Change Max Order Count to 10.
- For Capacity_1, enter the value 15000.
- For Route Constraints, enter the following values:
Parameter
Value
Description
Max Total Time
360
Due to workday constraints, drivers can't have a work shift of more than six hours (360 minutes).
Max Total Travel time
120
To satisfy the workday constraints and still serve a reasonable number of stores—while considering the service time needed at a store—the truck should not spend more than two hours (120 minutes) driving on the streets.
Max Total Distance
80
To balance daily fuel and maintenance costs among the fleet, each truck should not travel more than 80 miles on its route.
- For Costs, enter the following values:
Parameter
Value
Description
Cost Per Unit Time
0.20
The truck driver is paid $12 per hour, so the wage is: $12.00/60 minutes = $0.20 per minute.
Cost Per Unit Distance
1.5
The average dollar amount spent per mile on fuel consumption, truck depreciation, and maintenance.
- Leave the default settings for the rest of the parameters and click the OK button.
Three routes are added to the attribute table of the Route sublayer.
Set the properties for the vehicle routing problem analysis
The VRP ribbon includes different sections where you can specify parameters for the layer.
- On the VRP tab, in the Travel Settings group, open the layer properties dialog box by clicking the Launch Travel Mode Properties button on the right corner of the Travel Settings section.

The Layer Properties: Vehicle Routing Problem dialog box appears.
- Expand the U-Turns section and from the drop-down list, select None.
- Click OK.
The Mode drop-down list shows <Driving Time> indicating that the travel mode is adjusted.
- In the Travel Settings group, ensure the Time Field Units is set to Minutes and the Distance Field Units is set to Miles.
Note:
The Time Field Units and the Distance Field Units settings are for the fields of the VRP sublayers and does not affect the direction units. The directions units are always reported in the standard of the locale being used.
- In the Default Date group, select Day of Week from the Default Date Type drop-down list.
- From the resulting drop-down list with days of the week, select Monday.
- In the Output Geometry group, select Straight Lines from the Output Geometry Linear Shape Type drop-down list.
Straight Lines output geometry is useful when you want to know the orders assigned to the route and the sequence they are visited. If you want to know the exact route that each vehicle will take, use the Along Network option.
Note:
The output geometry options only affect the display of the routes, not the results determined by the VRP solver.
Note:
This setting is not available if using ArcGIS Online.
Run the analysis
Run the VRP analysis to determine the best route assignment and order sequence.
- On the VRP tab, click Run

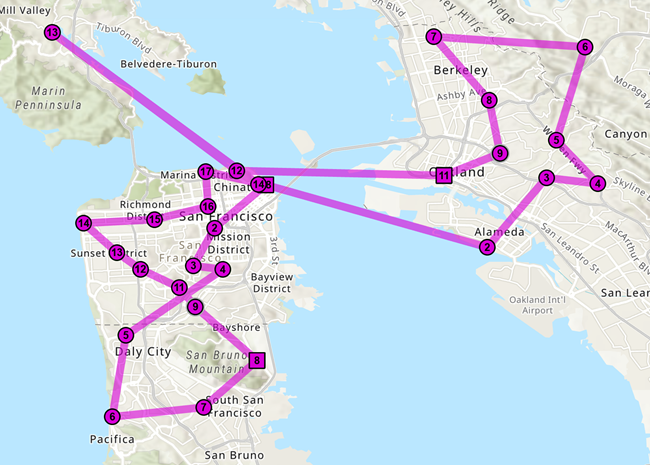
The VRP solver calculates the three routes required to service the orders and draws lines connecting the orders. Each route begins and ends at the distribution center and serves a set of orders along the way.
Determine turn-by-turn directions for the routes
You can see the detailed maneuver directions on the Directions pane.
- On the VRP tab, in the Directions group, click the Show Directions button
 .
. The Directions pane appears, showing turn by turn directions for each route.
Note:
The directions units are reported in metric or imperial system based on the standard for the locale being used.
- If you want to continue to the following advanced sections of this tutorial exercise, close the Directions pane. Otherwise, save the project and exit ArcGIS Pro.
Make changes to the existing solution to solve a different scenario: delete an existing route
The VRP solution obtained earlier worked well for the company. After a few weeks, however, the driver assigned to Truck2 went on vacation. The distribution company must now service the same stores but with just two trucks. To accommodate the extra workload, the company decided to pay overtime to the other two drivers and provide them with one paid break during the day. The distribution company also acquired two additional satellite distribution centers. These centers can be used by the trucks to renew their truckload while making their deliveries instead of returning to the main distribution center for renewal. You will modify the solution obtained from the previous step to accommodate these changes.
- In the Contents pane, right-click Routes and select Attribute Table from the context menu.
The attribute table appears with the input and output fields for each route.
- Select the row for Truck2 and click the Delete Selection button on the table view.
This removes the row from the table as well as the corresponding route from the map.
- Click the Edit tab, and in the Manage Edits group, click the Save button
 .
. - Click Yes on the Save Edits dialog box.
Modify routes to include overtime
To accommodate the extra workload, the company wants to remove the maximum time, maximum travel time, and maximum distance constraints for the routes. Since the drivers have to work longer than before, they are provided with overtime pay at the rate of $18 per hour after completing six hours of work. In this step, you will make these changes to the routes.
- With the Routes attribute table still open, scroll through the table to the OvertimeStartTime field and double-click to edit.
- Edit Truck1 and Truck3 so they
match the values in the table below. For the attributes that have a <Null> value, remove the value that is present.
Field name
Value
Description
OvertimeStartTime
360
The driver is paid overtime if he or she works for more than six hours (360 minutes).
CostPerUnitOvertime
0.3
The truck driver is paid $18 per hour for the overtime. So, the wage in dollars per minute is $18.00/60 minutes = $0.30 per minute.
MaxOrderCount
20
Since the driver is paid overtime, he or she is expected to service more stores.
MaxTotalTime
<Null>
There are no restrictions on the total duration of the work shift for the driver.
MaxTotalTravelTime
<Null>
There are no restrictions on the time spent driving the streets.
MaxTotalDistance
<Null>
There are no restrictions on the total distance traveled by a truck.

- Click the Edit tab, and in the Manage Edits group, click the Save button
 .
. - Click Yes on the Save Edits dialog box.
- Close the Routes attribute table.
Add route renewals
The company acquired two satellite distribution centers at 800 Brush Street and 100 Old County Road that act as renewal locations for the trucks. The trucks can refill their cargo by visiting these renewal locations and save time by not returning to the starting depot. You will add the renewal locations to the Depots network analysis class by geocoding their addresses. The routes that can renew at a renewal location and the service time for the renewal are specified in the Route Renewals network analysis class.
The first set of steps is to put the renewal locations into the Depots sublayer.
- Click the Map tab, and in the Inquiry group, click the Locate button
 .
. The Locate pane appears.
- Click the Options drop-down button next to the search box and select Provider Settings.
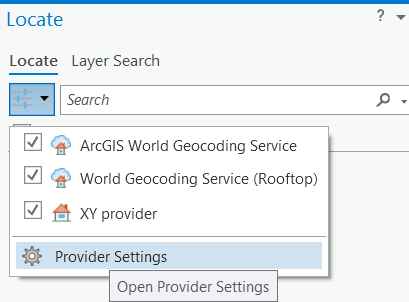
- Click the Add Locator to Project button .
The Select Existing Locator dialog box appears.
- Browse to the location of the tutorial data and select SanFranciscoLocator.loc.
- Click OK on the Select Existing Locator dialog box.
SanFranciscoLocator.loc is added to the Provider Settings pane.
- Click the Back to Locate Pane button.
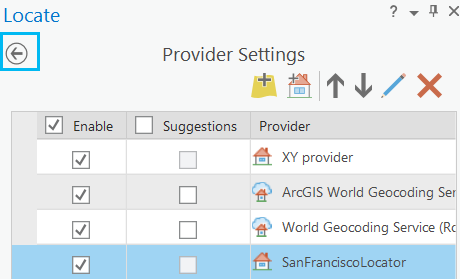
- In the Search box, type 800 Brush St. and press Enter.
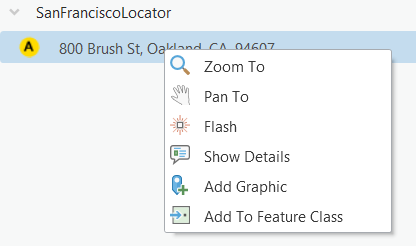
- Right-click 800 Brush St, Oakland, California, 94607 under the SanFranciscoLocator and select Add To Feature Class
 from the context menu.
Note:
Using World Geocoding Service as the locator uses credits.
- From the Add To Feature Class dialog box, expand Vehicle Routing Problem : Depots and select Depots.
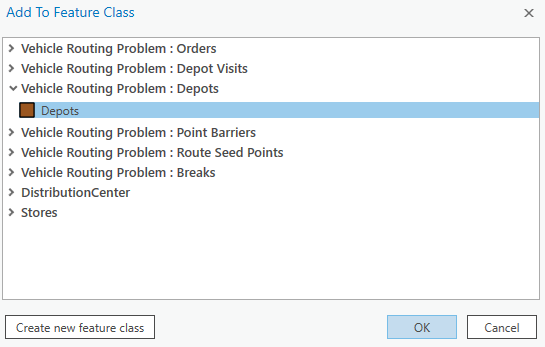
- Click OK.
A depot is added to the Depots attribute table and added to the map.
- Repeat steps 7–10 with the address 100 Old County Rd, Brisbane, California, 94005.
- Close the Locate pane.
- In the Contents pane, right-click the Depots sublayer, and select Attribute Table from the context menu.
- In the Depots attribute table, double-click the Name field to change the name of the newly added depot names from 800 Brush St depot to Brush St and from 100 Old County Rd depot to Old County Rd respectively.
These names must match exactly in the next set of steps for adding the route renewal information.
- On the Edit tab, in the Manage Edits group, click the Save button
 .
. - Click Yes on the Save Edits dialog box.
- Close the Depots attribute table.
- In the Contents pane, right-click the Route Renewals subtable, and click Open.
The table is empty.
- Click the row Click to add new row.
- Add the following information in the attribute table.
RouteName
DepotName
ServiceTime
Truck1
Brush St
30
Truck3
Brush St
30
Truck1
Old County Rd
30
Truck3
Old County Rd
30
Make sure the spelling matches what was used in the Depots and Routes tables Name fields. The attribute table should resemble the image below:

- On the Edit tab, in the Manage Edits group, click the Save button
 .
. - Click Yes on the Save Edits dialog box.
- Close the Route Renewals attribute table.
Add breaks
Since the drivers must work longer, they require one half-hour break during their work shift. In this step, you will specify the breaks for each route.
- On the VRP tab, in the Input Data group, click the drop-down arrow for Import Breaks and select Add Breaks.
The Add Locations window appears.
- Make sure the Input Vehicle Routing Problem Layer parameter is set to Vehicle Routing Problem.
- Leave the Target Route Name blank.
This indicates that the breaks you set up apply to all routes and entries will be made for each route currently in the Routes attribute table.
- Ensure the Break Type is set to Time-Window Break.
- Check the Is Paid box.
The drivers will be paid during this time so the cost associated with the time spent on break will be included in the total cost of the route.
- Set Break Duration to 30.
The drivers are given a 30-minute lunch break.
- Set Time Window Start to 12:30 PM.
- Set Time Window End to 1:30 PM.
- Set Maximum Violation Time to 0
The breaks must start between 12:30 p.m. and 1:30 p.m. The zero value indicates that the break can't start after 1:30 p.m.
- Leave the default settings for the rest of the parameters and click the OK button.
The Breaks attribute table now shows two entries, a paid lunch break between 12:30 p.m. and 1:30 p.m. for each of the routes (Truck1 and Truck3).
Run the analysis
Complete the following steps to run the analysis:
- On the VRP tab, click the Run button
 .
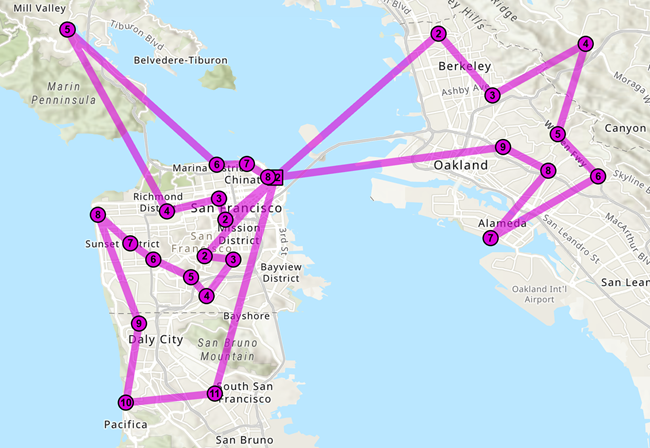
. The VRP solver calculates the two routes that can be used to service the orders and draws straight lines connecting the orders. Each route begins and ends at the distribution center, serves a set of orders along the way, visits a renewal location to load the truck again, continues to service the remaining orders, and returns to the distribution center.
The Depot Visits attribute table can be examined to see information about how much quantity was loaded at the beginning of the day and when visiting the renewal locations. It will also show the expected arrival times at these locations.
