Working with multidimensional raster data can be challenging, especially when there are many slices of data and multiple variables with which to work. Using the Multidimensional tab, you can visualize your data and perform analysis.
Note:
The Multidimensional tab is available starting in ArcGIS Pro 2.5.
Work with the Multidimensional tab
The Multidimensional tab is enabled when you load a multidimensional dataset into a map and select it in the Contents pane. When the Multidimensional tab is enabled for a multidimensional raster layer or a multidimensional mosaic layer, it provides tools and
functionality to work with multidimensional raster
data. The tab contains tools that allow you to manipulate your spatial and dimensional data, display the slice in the map view, open the temporal profile chart, and perform data management and analysis.
Multidimensional Extent
Use the Multidimensional Extent group to limit the variables, dimension extent, and area of interest you want to view and process for the multidimensional layer selected in the Contents pane. Select the variable or variables to view in the Variables drop-down list, and use the Area of Interest drop-down menu to limit the spatial extent of the layer you are viewing. Use the Start and End values to limit the dimension extents.
The extent values are used in geoprocessing tools. For example, if you choose to view two of four possible variables, and you select a six-month period from five years of data, any geoprocessing tool that references the active multidimensional layer will limit processing to the two variables over six months. Additionally, the multidimensional extent is reflected in the time slider and range slider for the active layer.

Note:
More options for defining the multidimensional extent are available using the Multidimensional Raster function in the Data Management group.
Current Display Slice
Use the Current Display Slice group to change the slice you are viewing on the map. You can also animate slices along a dimension using the Play Slices Along button  . The slices are limited by the extents set in the Multidimensional Extent group.

Analysis
The Analysis group provides access to a number of tools and functions for processing your multidimensional data. Click the Temporal Profile button  to create a new temporal profile chart for the multidimensional raster layer. Click the buttons in the Analysis gallery to open geoprocessing tools to analyze your multidimensional raster. Use the Summary Statistics gallery to calculate one of many summary statistics options, generating a new temporary layer on your map.

Note:
The tools Summary Statistics gallery require the ArcGIS Image Analyst or the Spatial Analyst extension. The tools in the Analysis gallery require the ArcGIS Image Analyst extension. Some Analysis tools are also available with the Spatial Analyst extension. The temporal profile does not require an additional license.
Data Management
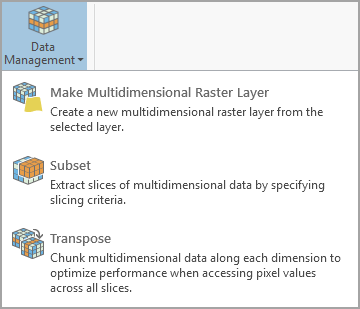
Use the Data Management drop-down menu to choose from a list of geoprocessing tools that manage or create multidimensional data. For example, use the Subset Multidimensional Raster tool to create a multidimensional raster that is a subset of your current layer.

The tools available in Data Management drop-down menu are contextual. If you are working with a multidimensional mosaic dataset or a layer generated from a NetCDF, HDF, or GRIB file, only the Make Multidimensional Raster Layer tool and the Subset Multidimensional Raster tool are available. If you are working with a multidimensional Cloud Raster Format (CRF) file, you can also use the Build Multidimensional Transpose tool and the Manage Multidimensional Raster tool.