Available with Image Analyst license.
The ArcGIS Image Analyst extension provides functions, tools, and capabilities for image and geospatial analysts who focus on the following areas:
- Image interpretation and exploitation
- Creation of information products from imagery
- Advanced feature interpretation and measurements from imagery
- Detailed feature compilation and measurement on stereo imagery
- Advanced raster and image analysis workflows for machine learning and feature extraction
Image analysts extract data and information from imagery using manual and computer-assisted methods. The Image Analyst extension provides advanced capabilities to support both image exploitation methods.
Manual image interpretation applications include Stereo Mapping, Image Space Analysis, and Full Motion Video (FMV). These applications support the collection of 2D and 3D feature data using standard feature creation and editing tools, saving feature class data in a geodatabase or as files, and sharing them in ArcGIS Enterprise.
Computer-assisted image exploitation includes advanced classification and a suite of raster functions and geoprocessing tools. Both functions and tools can be chained together into custom algorithms using raster functions, templates, and models, respectively. These processing chains can be deployed on the desktop or distributed processing environments in ArcGIS Enterprise either on-premises or through a portal.
The suite of functions, tools, and capabilities for advanced image analysis requires the Image Analyst extension.
Capabilities
The capabilities, functions, and tools that are provided in the Image Analyst extension are geared toward image analysts who perform manual image interpretation, advanced remote sensing, and semiautomated image processing feature extraction. These image exploitation activities are grouped into the following functional categories:
- Perspective imagery—Work with oblique imagery oriented in a natural perspective mode to facilitate effective image interpretation applications.
- Image classification and pattern recognition—ArcGIS geoprocessing toolset containing tools that find, identify, and quantify patterns in imagery data. Perform object-based and traditional image analysis using image segmentation, classification, and regression analysis tools and capabilities.
- Deep Learning—Perform image feature recognition using deep learning techniques.
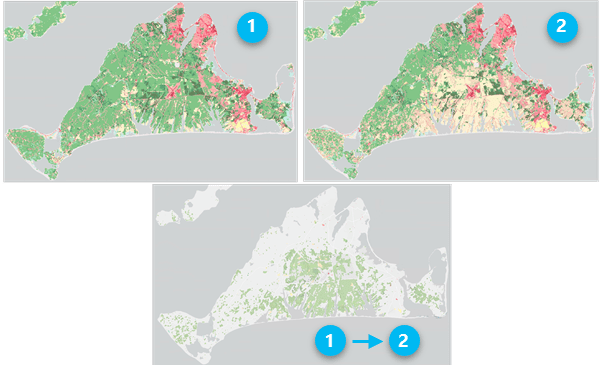
- Change detection—Compare multiple images or rasters to identify the type, magnitude, or direction of change between dates.
- Multidimensional analysis—Perform complex analysis on multidimensional raster data to explore scientific trends and anomalies.
- Pixel Editor—Edit individual pixels and objects, groups of pixels and objects, and regions in raster and imagery data.
- Stereo mapping—Visualize imagery and capture 3D feature data in a stereo viewing environment.
- Motion Imagery—Work with geospatially enabled video data together with your GIS data to assist in timely, well-informed decision support.
- Raster functions—Perform real-time raster analysis and image processing on an extensive suite of remote sensing data types, and save your results if desired. Create raster function chains and deploy them on the desktop or in distributed processing and storage environments on-premises or in the cloud.
- Geoprocessing tools—Perform remote sensing analysis and image processing using individual tools, and create and deploy them in processing models locally on the desktop or in distributed processing and storage environments on-premises or in the cloud.
These capabilities, functions, and tools are described in more detail below.
Perspective image analysis
Imagery is often collected at significant angles, referred to as oblique imagery. It is useful for ascertaining information about features such as buildings, bridges, towers, and engineering infrastructure that is not obtainable from vertical imagery. Satellite imagery is often collected at angles greater than 15 degrees off-nadir, as is aerial and drone imagery. Displaying oblique imagery in a map projection system causes buildings and other ground features to appear to lean at a variety of disorienting angles, making oblique imagery hard to interpret. It can also be severely distorted by rectifying it to fit the map projection.
ArcGIS Pro enables viewing and working with oblique imagery in perspective mode. It is displayed with buildings and features oriented vertically toward the top of the display, which better enables image interpretation applications. Perspective mode displays images in image space (in columns and rows) rather than map space (in a map projection system) by using an image coordinate system (ICS). The ICS facilitates the seamless transformation between image space and map space and allows additional image and GIS layers to be properly registered to the imagery. The ICS uses the metadata containing image orientation and position information, along with other pertinent information about how and when the image was collected, to support the transformation between image space and map space. Enabling imagery in image space in the map view is referred to as perspective mode.
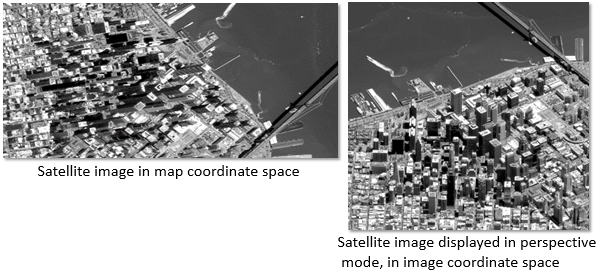
Oblique imagery contains information not available from vertical imagery, such as building facades, points of ingress and egress, profiles of features and objects, and more. Oblique imagery displayed in perspective mode is useful for manual image interpretation applications and for collecting and recording information about features. An important capability of oblique imagery is the ability to create and edit features in image space and save them in a map projection of choice. Additionally, features can be interactively measured in perspective mode, and results are displayed and recorded in your units of choice.
Image classification and pattern recognition
Image classification is one of the most effective and efficient ways to transform continuous imagery into categorical data and information for inventory and management of assets and land units. It is a computer-assisted approach to processing imagery in which the image analyst initiates steps and techniques for a classification method, and the computer executes the supporting computations. The analyst intercedes at critical junctures to make decisions that determine the type and characteristics of the classification results.
Two main types of classification approaches are supported: object-oriented classification and pixel-based classification. Object-oriented classification is based on image segmentation, in which adjacent pixels with similar multispectral or spatial characteristics are grouped into objects. These objects, sometimes called superpixels, represent partial or complete features and are processed using a variety of classifiers to produce a class map. Pixel-based classification follows a similar process, in which pixels are classified into categories defined by the analyst.
Supported classifiers include both traditional and advanced machine-learning approaches. Traditional classifiers are based on statistical-based methods such as unsupervised isocluster and supervised maximum likelihood classification. Advanced classifiers are based on sophisticated machine-learning methods, including random trees, support vector machine, and deep learning.
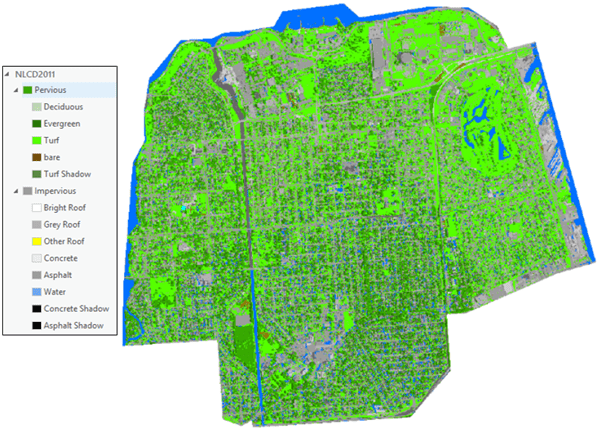
Once imagery is initially classified, the accuracy is assessed and the class map is refined to correct either the class categories or regions within the class map in an iterative manner. Accuracy assessment can be performed on both the input training data and the resulting class map output.
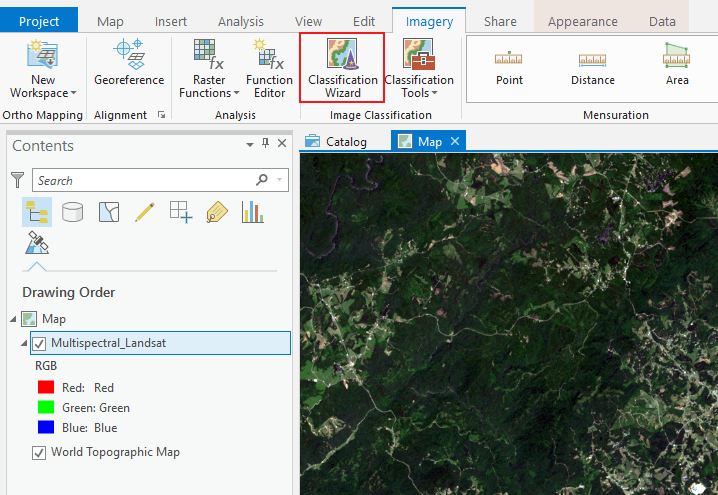
The classification process usually requires several steps to progress from properly preprocessing the imagery, assigning the class categories and creating relevant training data, executing the classification, and assessing and refining the accuracy of results. The Classification Wizard guides the analyst through the classification workflow and helps ensure acceptable results.
The class map, with its associated symbology, can be saved or converted to a GIS vector file with an associated attribute table.
Machine learning nonparametric regression analysis tools model the relationship between independent bands of image and raster data and reference (ground truth) information. Regression analysis identifies patterns in imagery associated with classes of features, and also predicts the occurrence of different classes in the imagery.
Deep Learning
Deep Learning tools detect features in imagery by using multiple layers in neural networks where each layer is capable of extracting one or more unique features in the image. These tools take advantage of GPU processing to perform the analysis in a timely manner.
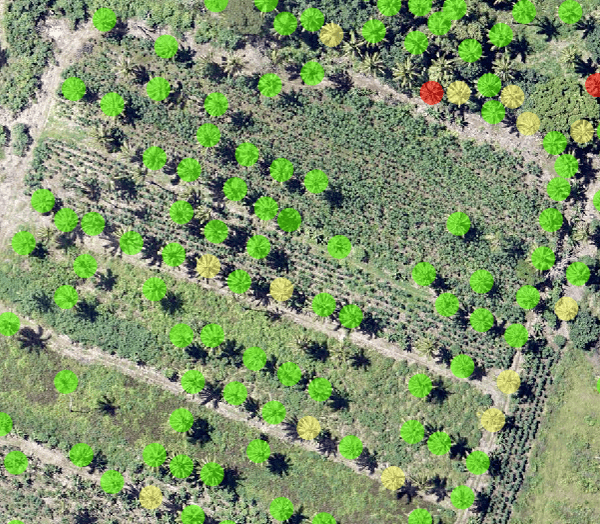
The deep learning workflow is to first select training samples for your classes of interest using the Training Samples Manager in ArcGIS Pro. The training samples are labeled and used in a deep learning framework such as TensorFlow, CNTK, or PyTorch to develop the deep learning model. The model is then input to the deep learning classification or detection tools in the Deep Learning toolset to extract information from imagery.
Change detection
Change detection is one of the fundamental applications in imagery and remote sensing. It is the comparison of multiple raster datasets, typically collected for one area at different times, to determine the type, magnitude, and location of change. Change can occur because of anthropogenic activity, abrupt natural disturbances, or long-term climatological or environmental trends.
You can perform change detection in ArcGIS Pro between multiple categorical raster datasets, such as land cover, or multiple continuous datasets, such as temperature or multiband imagery. You can use multiband imagery to compute the difference in a feature's spectral reflectance between two dates, or you can compute a band index before comparing results.
The Change Detection Wizard provides a guided experience for three distinct change detection workflows. The Change Detection toolset contains a tool that supports both categorical change or pixel value change. The Multidimensional Analysis toolset contains additional tools for change detection along a time series of images.
Multidimensional analysis
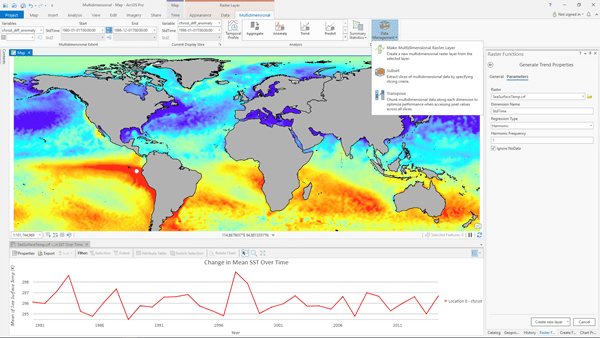
Multidimensional analysis tools and capabilities allow you to perform and visualize complex analysis on multidimensional raster data to explore scientific trends and anomalies. Multidimensional data represents geospatial data captured at multiple times and multiple depths or heights. These data types are commonly used in atmospheric, oceanographic, and earth sciences. Multidimensional raster data can be captured by satellite observations where data is collected at certain time intervals, or generated from numerical models where data is aggregated, interpolated, or simulated from other data sources.
Adding a multidimensional raster layer to the map view allows you to display or examine your variables in one file. The Multidimensional tab is activated and provides capabilities to manage, visualize, and process multidimensional raster data and publish results as a web service.
Pixel Editor
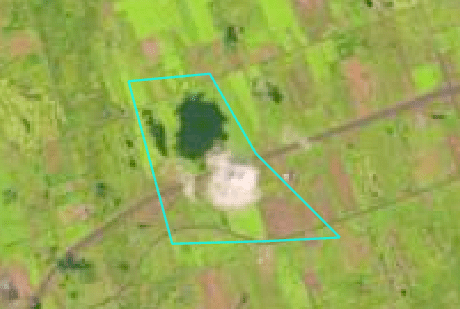
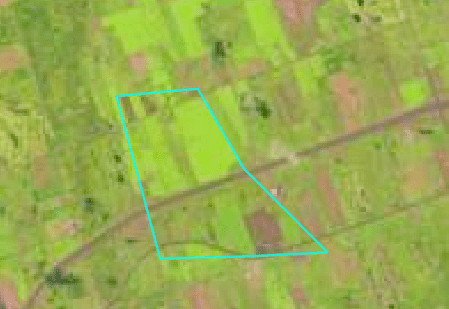
The Pixel Editor provides a suite of tools to interactively manipulate pixel values for raster and imagery data. It allows you to edit individual pixels and objects, groups of pixels and objects, and regions in raster and imagery data. The types of operations that you can perform depends on the data source type of your raster dataset.
The Pixel Editor tools allow you to perform several editing tasks on your raster datasets:
- Edit multispectral and single-band imagery.
- Edit elevation data to fill voids, and remove spikes or holes.
- Reclassify pixels, regions, or objects.
- Reclassify pixels using feature data.
- Use preset filters to smooth areas.
- Remove above-ground features to create a bare earth elevation surface.
- Replace a cloudy region with another region of pixels.
- Obscure or redact confidential pixels.
Stereo mapping
With the stereo mapping capability, you can compile 3D feature data in a stereo viewing and mapping system. This capability allows you to visually analyze imagery and accurately collect features of interest.
The stereo mapping capability in Image Analyst includes a stereo map viewer that displays and manipulates stereo image pairs from satellite, aerial, and drone sensor platforms. The stereo display supports multispectral, three-band, and panchromatic imagery, direct enhancement of imagery, superimposition of 3D GIS data on stereo imagery, zooming and roaming, and other image adjustments.
The photogrammetrically accurate 3D pointer measures and collects ground features directly into feature classes. Two types of 3D eyewear are supported: lightweight active shutter glasses and anaglyph cyan/red glasses.
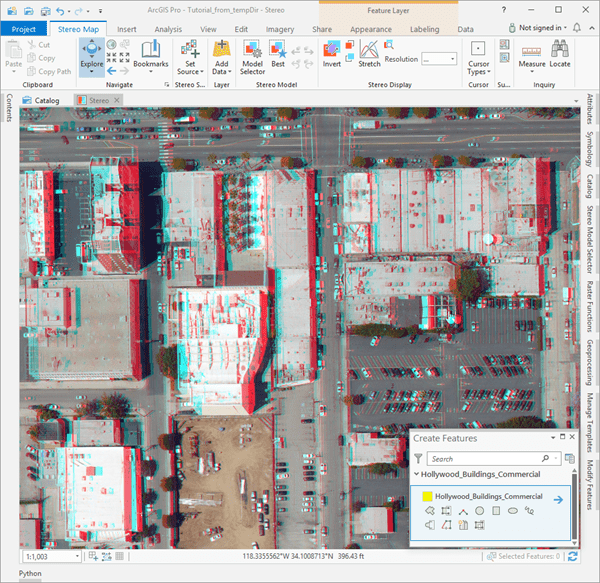
The Stereo Map tab contains tools to set up, enhance, and manage stereo models, and superimpose vector GIS data on stereo imagery; ground feature measurement tools; and a stereo model manager. The standard feature creation and editing tools are used for a familiar experience to compile 3D features into feature classes. Newly created or updated features conform to your existing feature templates and maintain your topology, styles, attributes, and other feature elements when saved.
Full Motion Video
Full Motion Video (FMV) provides capabilities for playing and geospatial analysis of FMV-compliant video data. FMV-compliant video data refers to the combination of a video stream and associated metadata into one video file, which makes the video geospatially aware. This geospatially enabled video data, along with the computational functionality of ArcGIS Pro, allows you to view and manipulate the video, while being fully aware of the sensor dynamics and field of view (FOV), and display this information in the map view. It also allows you to analyze, create, and edit feature data in either the video view or the map view. These capabilities are available with video data in live streaming mode or archived video data.
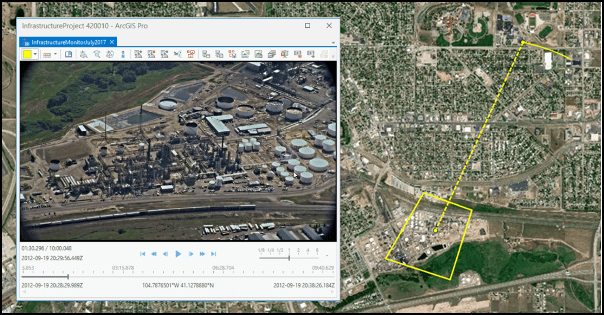
If your video data does not include the required metadata, the Video Multiplexer tool will combine your video and metadata files into one FMV-compliant file. Additionally, if there is an offset between your video and metadata, such that the video footprint displayed on the ground does not match the imagery displayed in the player, you can make adjustments to synchronize them.
The FMV capability is important for situation awareness applications, such as disaster assessment and response. FMV uses deep learning to enable object tracking in the video player. You can have GIS layers loaded in your map, and have video feeds from multiple drones playing in multiple FMV players at the same time, and view the video footprints displayed on the map. Assess and collect features of damage or distress situations visible in the videos and see those features displayed on the map together with your other GIS data and information. By integrating the geospatial aspects of FMV-compliant video with GIS functionality, FMV enables well-informed decision support in operational scenarios.
Raster functions
Image analysts and remote sensing professionals frequently develop and deploy their own image processing chains and algorithms tailored for specific applications and datasets. While workflows may be generally well defined, analysts often need to adjust and refine parameter settings, depending on physical, atmospheric, environmental, and data characteristics. Raster functions provide a flexible and powerful way to develop and refine image processing workflows.
Raster functions are dynamic operations that apply on-the-fly processing directly to the image pixels in the display. You see your image processing results immediately as you pan and zoom on the imagery in your display. Since no intermediate datasets are created, processes and adjustments to processing parameters can be applied quickly. The results are not saved to a file on disk by default.
Raster functions can be combined into function chains that can be saved as raster function templates using the Function Editor. Raster function templates can also be shared as processing templates in your ArcGIS Online organization or in your ArcGIS Enterprise deployment.
An extensive list of raster functions is provided with the Image Analyst extension. These functions are grouped into categories of related functionality in the following table. Each function is linked in the table to its detailed description.
Image Analyst function categories
| Function category | Description |
|---|---|
Use the analysis functions to analyze multidimensional and imagery datasets. | |
Use the segmentation and classification functions to prepare segmented rasters or pixel-based raster datasets to use in creating classified raster datasets. | |
The general math functions apply mathematical functions to the input rasters. These tools fall into several categories. The arithmetic tools perform basic mathematical operations, such as addition and multiplication. There are tools that perform various types of exponentiation operations, which include exponentials and logarithms, in addition to the basic power operations. The remaining tools are used either for sign conversion or for conversion between integer and floating point data types. | |
The conditional math functions allow you to control the output values based on the conditions placed on the input values. The conditions that can be applied are of two types, queries on the attributes or a condition based on the position of the conditional statement in a list. | |
The logical math functions evaluate the values of the inputs and determine the output values based on Boolean logic. These functions process raster datasets in five main areas: Bitwise, Boolean, Combinatorial, Logical, and Relational. | |
The trigonometric math functions perform various trigonometric calculations on the values in an input raster. | |
Use the statistics functions to perform statistical raster operations on a local, neighborhood, or zonal basis. |
Geoprocessing tools
As noted above, image analysts and remote sensing professionals often develop and deploy their custom processing workflows for particular applications. These professionals can combine geoprocessing tools into geoprocessing models, similar to raster function templates (RFTs). The main difference between geoprocessing models and RFTs is that the results from a geoprocessing model are always saved to disk. Models can also be shared to members of your enterprise and deployed in distributed processing environments on-premises or in the cloud with ArcGIS Enterprise.
An extensive list of geoprocessing tools is provided with the Image Analyst extension. These tools are grouped into categories of related functionality in the following table. Each tool is linked in the table to its detailed description.
Image Analyst geoprocessing toolsets
| Toolset | Description |
|---|---|
The Change Detection toolset contains tools that perform change detection between raster datasets. | |
Detect objects or classify imagery using deep learning tools. | |
The Extraction toolset allows you to extract a subset of pixels from a raster by the pixels' attributes or their spatial location. | |
Map algebra is a way to perform spatial analysis by creating expressions in an algebraic language. With the Raster Calculator tool, you can create and run map algebra expressions that output a raster dataset. | |
The general math tools apply a mathematical function to the input. These tools fall into several categories. The arithmetic tools perform basic mathematical operations, such as addition and multiplication. There are tools that perform various types of exponentiation operations, which include exponentials and logarithms in addition to the basic power operations. The remaining tools are used either for sign conversion or for conversion between integer and floating point data types. | |
The conditional math tools allow you to control the output values based on the conditions placed on the input values. The conditions that can be applied are of two types: queries on the attributes or a condition based on the position of the conditional statement in a list. | |
The logical math tools evaluate the values of the inputs and determine the output values based on Boolean logic. The tools are grouped into five main categories: Bitwise, Boolean, Combinatorial, Logical, and Relational. | |
The trigonometric math tools perform various trigonometric calculations on the values in an input raster. | |
The Motion Imagery toolset contains tools for managing, processing, and analyzing motion imagery, including full motion video data. | |
Perform analysis on scientific data across multiple variables and dimensions. | |
The Overlay tools allow you to overlay several rasters and perform various operations on them. | |
Perform traditional or advanced machine learning image classification on segmented or pixel-based imagery. | |
Use the Statistical tools to perform statistical raster operations on a local, neighborhood, or zonal basis. |