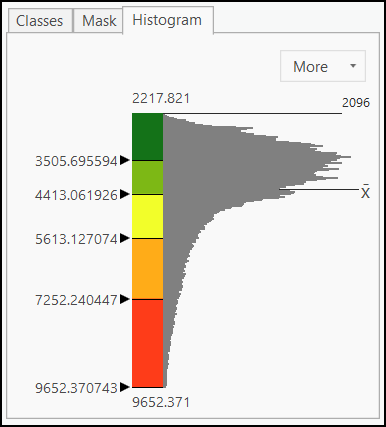
You can analyze and edit a histogram using the Histogram tab in the Symbology pane for the Classify renderer.
Histograms display the frequency distribution of data of a single variable. The symbology histogram visualizes the distribution of data across the chosen symbolized field. You can use this histogram to view whether the data follows a symmetric, skewed, or modal pattern and how the data can be symbolized to show outlying or prominent pixels on your map.
View the histogram of your symbology
To view the histogram for your classified raster layer, complete the following steps:
- In the Contents pane, click a single band raster layer to select it.
- Under Raster Layer, on the Appearance tab, click the Symbology button
 to open the Symbology pane.
 - In the Symbology pane, on the Primary symbology tab
 , ensure that the Classify symbology type is selected. Set the field, color scheme, and other symbology properties as needed.
The Histogram tab is displayed and activated in the statistics section of the Symbology pane.

- If necessary, click the Histogram tab to view the distribution of the data in the field in the context of the current symbology.
- Click the More drop-down arrow to display the statistics of the layer. You can also reverse the order of the color scheme or reverse the histogram values.
Modify symbology with the histogram
You can use the histogram to directly change how values are symbolized in your raster layer. The gray horizontal bars of the histogram represent the distribution of the data and shows how the current classification method applies to the data. To view the distribution and class breaks more easily, drag the expander bar above the histogram up to make it larger in the pane.
The ramp of a Classify symbols histogram represents the relative size of each class. Drag the upper limit to set the maximum value for the class break. You can right-click anywhere on the ramp and click Insert break to add a class break. To remove it, right-click the break value and click Remove break. If you double-click any of the values, the classes for the layer in the Contents pane are updated, including the class labels if edited.