Network dataset layer symbology allows you to visualize all the elements of the network dataset. Network dataset layer stores the symbology of edges, junctions, system junctions, dirty areas, and when available, turns and traffic. Network dataset layer symbology can help with the following scenarios:
- Increase efficiency of quality assurance and quality control of the network dataset.
- See the dirty areas and identify the changes made in the network dataset.
- Change the symbology of traffic.
- Turn on or off the symbolization of specific categories (such as edges or junctions).
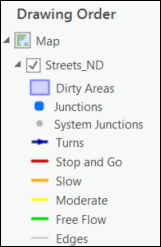
A network dataset layer can symbolize up to six distinct rendering source categories:
- Edges
 —Edges connect to other elements (junctions) and are the links over which agents travel.
 - Junctions
 —Junctions connect edges and facilitate navigation from one edge to another.
 - System Junctions
 —When you don't create a junction source feature at the end of an edge, a system junction is created automatically when the network dataset is built.
 - Turns
 —Turns store information that can affect movement between two or more edges.
 - Traffic
 —In a network that supports traffic, you can store travel speeds using two models: historical and live traffic. This allows you to visualize traffic on a map and perform network analysis given current or typical traffic speeds.
 - Dirty Areas
 —Dirty areas allow you to see where edits to source features have been made since the last time when the source network dataset of the layer is built. Rectangles surround and highlight the portions of the network dataset that are out of date due to the edits. When you rebuild the network, only the dirty areas are rebuilt, which can be much faster than rebuilding the entire network. If properties of the network dataset are altered, the entire network dataset may be covered by a dirty area, indicating all the elements of the network need to be rebuilt.
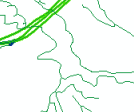
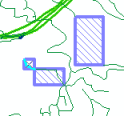
The following graphics demonstrate a scenario in which dirty areas are generated:

This is an existing road network before any edits are made to source features. 
Here is the same network after a road was deleted (upper right dirty area) and two roads were created (lower left dirty areas).
Learn more about network elements
The following is an example of the Contents pane for a network dataset layer configured with a symbolizer assigned to each category:
Change the properties of a symbolizer assigned to a category
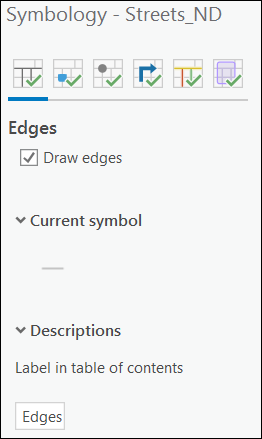
If a category has a symbolizer assigned, it is drawn and a green check mark appears on its tab icon. You can update the properties of any category symbolizer in the Symbology pane. The pane has up to six sub-tabs: one for each category supported by the source network dataset of the layer. Each category, except traffic, starts with a single symbol renderer. The traffic category instead can use a symbolizer that uses multiple symbols, each one assigned to a different speed ratio range according to the specified break values.
Note:
Only the supported rendering source categories of the network dataset referenced by the network dataset layer will have a corresponding sub-tab in the Symbology pane.To customize the properties of a single symbol type symbolizer for a category, select the appropriate category sub-tab in the Symbology pane and follow the steps below:
- Make sure a network dataset is added to the Contents pane.
- On the Appearance ribbon, click the Symbology button.
The Symbology pane appears.

- Choose the category you want to customize.
- If needed, check or uncheck the draw category check box—for example, Draw edges—to turn on or off the visibility of the source category.
- To change the symbology, click the symbol under the Current symbol section.
The Symbology pane now has options to customize the symbol.
- Make the necessary changes and click the Apply button at the bottom.
The symbology changes for the selected category.
- Click the Back button to return to the Symbology pane.
- If needed, change the label of the category by typing in the text box under Descriptions.