Available with Spatial Analyst license.
Available with 3D Analyst license.
The Geodesic Viewshed tool determines surface locations visible to a set of point or polyline observers, using geodesic methods. The tool transforms the elevation surface into a geocentric 3D coordinate system and runs 3D sight lines to each transformed cell center. It will take advantage of a graphics processing unit (GPU), if available on your system. It optionally accommodates vertical uncertainty or error in the input elevation surface. It also optionally produces an observer-region relationship table for up to 32 observers (points, multipoints, or polylines) that can be related back to the input observer feature class.
Since the computation is performed in a true 3D coordinate system, the Geodesic Viewshed tool does not need the earth curvature correction parameter. It also uses the z units of the input spatial reference, if available, rather than a z-factor parameter. Finally, since each 3D sight line is evaluated independently of other sight lines, it avoids some of the errors that can creep into a wavefront-based viewshed algorithm (such as the existing viewshed family of geoprocessing tools). Thus, the Geodesic Viewshed tool produces more accurate visibility and Above Ground Level (AGL) surfaces than the Viewshed tool.
The determination of visibility
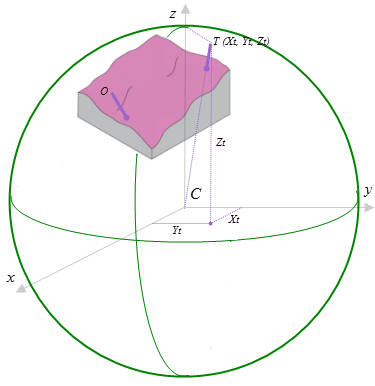
This tool uses geocentric 3D points for observers, targets, and elevation surface cell centers. A target is a surface cell center that has an optional, additional offset added to it. A geocentric 3D coordinate system is a right-handed Cartesian coordinate system with the center of the earth as the origin C, the x axis pointing to the intersection of the prime meridian and the equator, the Z axis pointing to the north pole, and the y axis rotated 90 degrees clockwise from the x axis while looking down from the north pole. See the following figure for an example of a target location T expressed with geocentric coordinates.
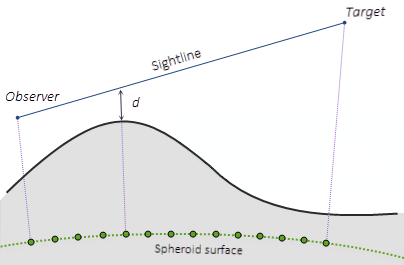
To determine the visibility of each target, 3D sight lines from each observer to each target are constructed. See the figure below for an illustration of how the sight lines are constructed. The ground path of each sight line on the spheroid is determined and divided into cell size steps. In this figure, the steps are shown as the green dots, and the distance between them is equivalent to the cell size. At each step, the vertical distance d between the sight line and the surface is calculated. The elevation of ground is estimated using a linear Inverse Distance Weighted (IDW) approach using the nearest cell centers. If d is positive for all ground steps along the sight line, the target is considered visible; otherwise, it is considered not visible.
Vertical error
The Vertical error parameter is only enabled when the analysis type is Frequency. It is used to account for the vertical uncertainty in the input elevation surface. When this parameter is 0 or not specified, a single sight line is cast between the observer and each target. The result is that the target is either visible or not visible. In this case, the output visibility raster records the number of times that each cell location in the input surface raster can be seen by any of the input observation points.
When the Vertical error parameter is greater than 0 (for example, 0.6 meters), some number of sight lines are cast between the observer and each target. For each sight line and each step, a uniformly distributed random number in the range of [-0.6, 0.6] is added to d. If d becomes less than zero, that particular sight line is terminated. In this case, each observer contributes a number between zero and one (the number of successful sight lines divided by the total number of sight lines, from that observer) to the output visibility raster, which is now of type single-precision float.
The determination of AGL
An Above Ground Level (AGL) raster is an optional output that represents the above ground height that the nonvisible target cells would need to be raised by to become visible. The following figure illustrates how the AGL value is determined. T is a target with a certain height (which is the target offset in the illustration). The sight line between the observer O and the target T is blocked by the terrain, so target T is not visible. If the target is raised to the new position T’, it becomes visible because there is now a clear sight line. The distance between T’ and the ground is the AGL value in the output raster.
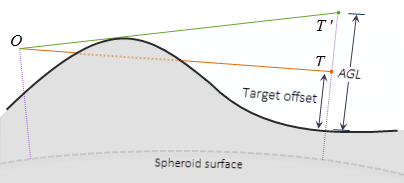
The computation of distance TT' does not assume that triangle OTT' is a right triangle.
Interpreting the output observer-region relationship table
When the analysis type is Observers, the tool outputs an observer-region relationship table, as shown in the following figure. In this table, the Observer field lists feature IDs from the input feature class. The Region field lists cell values for regions in the output visibility raster. Thus, the table lists the regions that are visible to each observer. You can use this table to look up the region IDs given an observer ID, and vice versa.
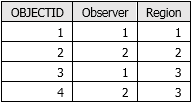
The same information is encoded in the output cell values of the visibility raster, but in a less accessible way. In this case, the output visibility raster contains the three values (1, 2, and 3), as shown in the following screen capture of the attribute table:

The input observers are sorted in ascending order by their OBJECTID values, and the output visibility raster reports the bitwise OR of their sorted positions. Raster Map Algebra can be used to extract information about which observers can see which regions, and that information can be related back to observer features using this sorting rule. An example is shown in the figure below. Assume that Observer 1 has ObjectID 1 and Observer 2 has ObjectID 2. Then Region 1 (the pale yellow area) in the output visibility map will have a cell value of 1. Region 2 (the blue area) in the output visibility map will have a cell value of 2. And Region 3 (the green area) in the output visibility map will have a cell value of 3, the numeric value of the bitwise OR of 1 and 2.
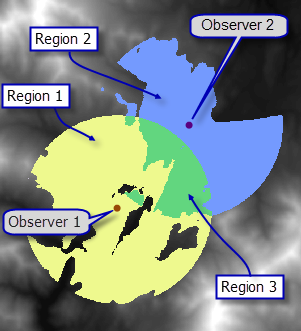
In the image above, the output cell values are the bitwise OR of the internal indexes of the input features. The observer-region relationship table reports this same information using feature class IDs instead of internal indexes.
Controlling the visibility analysis
It is possible to limit the field of view for each observer by specifying various numerical values or fields in the observer parameters. These observer parameters are functionally the same as the view cone fields—such as OFFSETA or OFFSETB—used for controlling the visibility analysis by the Viewshed tool. The difference is that the Geodesic Viewshed observer parameters can take any numerical fields and are not limited to any specific field names.
Use of a GPU
This tool is capable of delivering increased performance if you have certain GPU hardware installed. More details on how this capability is supported, how to configure it, and how to enable it is provided in the GPU processing with Spatial Analyst topic in the ArcGIS Spatial Analyst extension help.
Optimize performance
Determining viewshed is a computer-intensive process. Some options to improve tool performance, other than using GPU hardware as described in the previous section, are listed below.
- Set the Outer radius parameter to a value (such as 25 kilometers) that is meaningful for your application. The tool will only process the cells within the viewing distance, thereby reducing the processing time. The larger the Outer radius, the longer it will take the tool to process it.
- Set Analysis method to Perimeter Sightlines. With this method, the tool only runs sight lines to the edge cells of the view cone, thereby reducing the processing time.
- If the input elevation raster covers a geographic area larger than your study area, set the Extent environment to your study area to reduce the size of the output raster.
Temporary space requirement
At run time, the Geodesic Viewshed tool will project the input raster into a 3D geocentric coordinate system for processing. Only the cells that fall in the buffer zone of the input observer features (with a buffer distance defined by the Outer radius parameter) will be projected. Each projected cell requires approximately 50 bytes of temporary space for the All Sightlines analysis method, and approximately 150 bytes of temporary space for the Perimeter Sightlines analysis method. Check the tool messages for the exact amount of temporary space required and the path where it will be written to. The temporary directory can be redirected to a different drive and path using the Microsoft Windows TMP environment variable, if the default temporary directory does not have enough free space available.