Available with Spatial Analyst license.
You can generate a PDF report of your model. The report identifies the key decisions made when creating the model. Share the report with stakeholders and decision makers or use it to better understand the model and know the following in more depth:
- The input criteria and how each is distributed in the study area
- How the criteria are transformed and weighted to create the suitability map
- The distribution of the suitability values on a map
- How the final regions were created and information on each
A report can be created for models with two to five transformed criteria. To create more complex models with six or more criteria, work with submodels.
Reports can be generated whether you create final regions or just a suitability map.
There are two target audiences for the report:
- The high-level decision maker who needs to implement the project
- The decision maker or the user that needs to understand the key decisions that were made when creating the model in more depth
Generate the report
A report can be created after a suitability model has been run. To create a report, do the following:
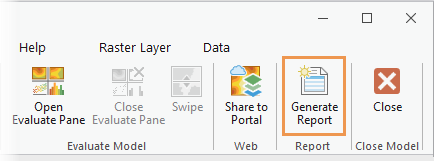
- On the Suitability Modeler ribbon, click the Generate Report button.
The Model Report dialog box appears. It lists the output model items that will be included in the report.
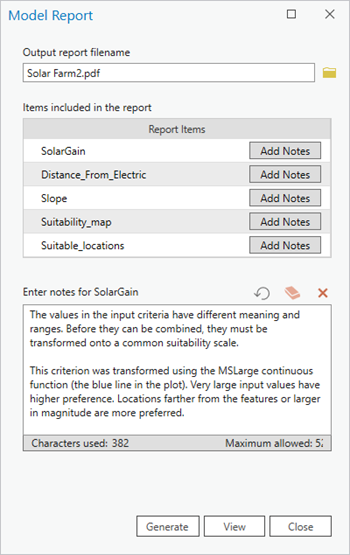
The Model Report dialog box with the default text for the first criterion item page is displayed. - Specify the Output report filename parameter value to set the location and name to use for the report.
- In the Items included in the report parameter list, review and update the item notes as needed.
- Click the Add Notes button to see the default text specific to each item and how it was created.
- In the Enter notes text box, review, edit, or add custom explanation text for each item page.
- Click the Reset to default notes button
 to bring back the original text.
 - Click the Erase all notes in notepad button
 to clear out all the notes content for an item.
 - Click the Close the notepad button
 when finished with your edits.
- When you are satisfied with the contents for the items, click the Generate button to create a PDF report.
- To preview the report, click the View button. Make the desired changes and generate the report again.
Report contents
The report consists of the following sections:
- A cover page
- An executive summary
- A flow diagram of the model
- Criterion transformation pages
- Weights and the suitability map
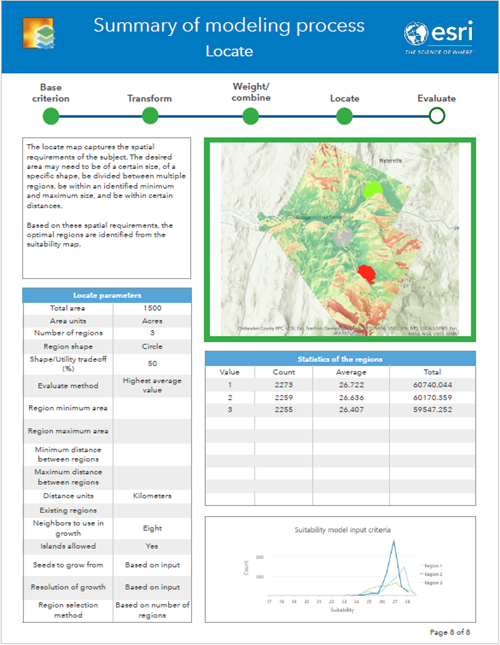
- Locate regions summary page
Note:
The sections may vary slightly if the final regions are not created.
Each of these sections are described below, with examples from a model in which the final regions were identified.
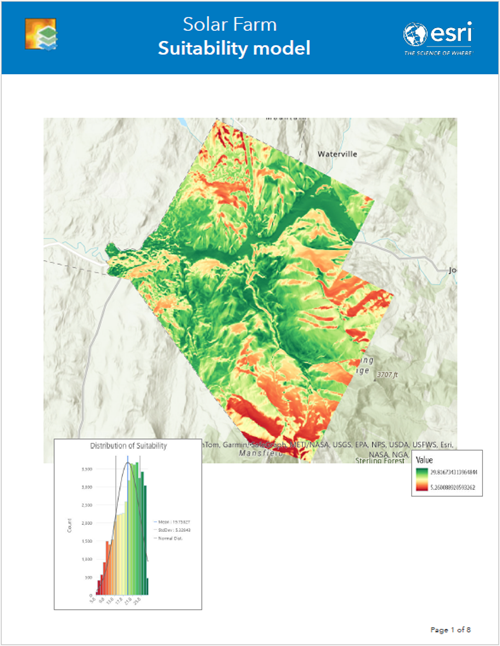
Cover page
The first page of the report is an introductory cover page. On this page as well as all the rest, the graphics and tables are created from the actual data, tables, and maps from your suitability model.
Executive summary
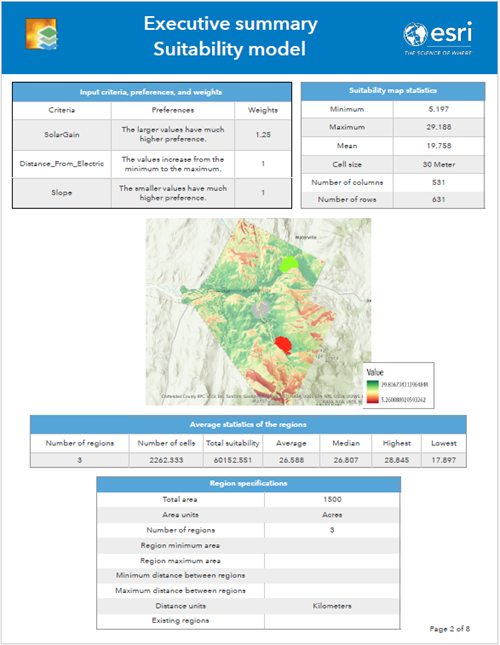
The Executive summary page shows the suitability map with the final locations displayed as well as several tables of information.
The first table lists the criteria, how they were transformed, and the weights used. The next table lists several statistics for the output suitability map. Below the map is a table that presents the number of regions identified and several statistics for them. The final table on this page provides various specifications for the regions.
The following image shows an example of the Executive summary page.
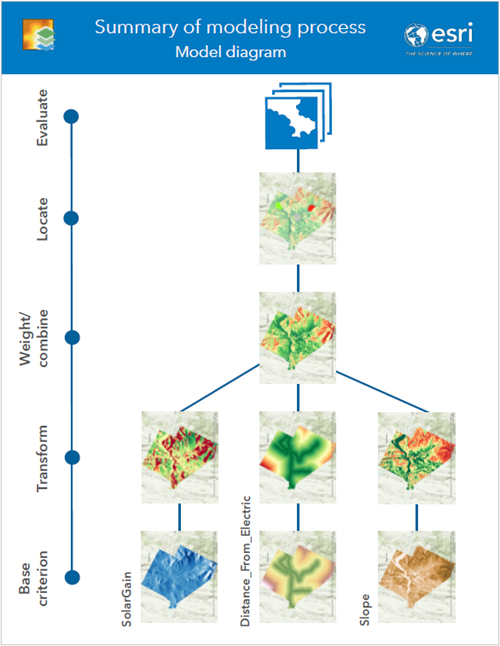
Model flow diagram
The third page of the report is a flow diagram of the suitability model that summarizes the modeling steps. It covers the process of going from the base criteria, the transformations applied, how they are weighted and combined to produce a suitability map, and the identification of the regions.
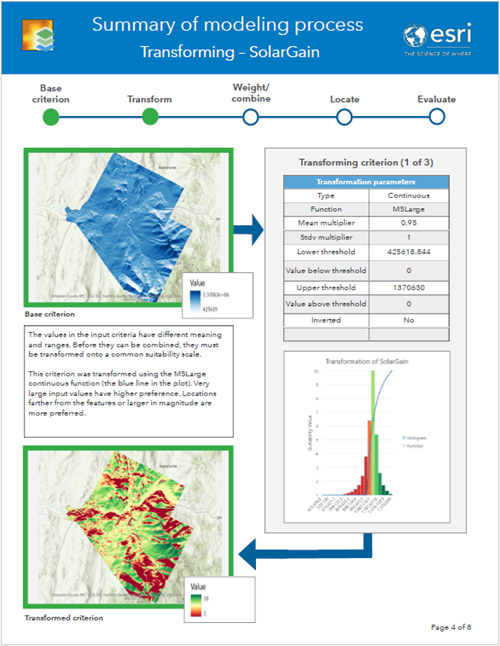
Criterion transformation pages
Next is a series of pages, one for each criterion. These pages show the base criterion, how it was transformed, a plot of the transformation, and the final transformed map for that criterion.
Each page also includes a description of the transformation. Default text is provided for each. The text changes based on which criterion it is, the transformation function that was applied, and any changes you made to the item page on the initial Model Report dialog box.
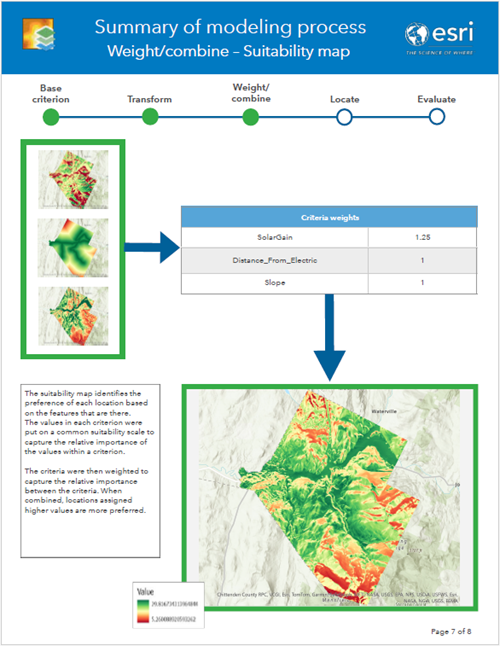
Weights and the suitability map
This page provides a summary table of the weights applied to each of the transformed criteria and a suitability map. The page captures the weight/combine step of the modeling workflow. Default text is provided, which can also be updated as needed.
Locate regions summary
If the Locate step was run, a page will be added that provides more detail on how the regions were created and statistics of each resulting region, as well as a map showing their locations.
