| Label | Explanation | Data Type |
Input 3D geostatistical layers
| The 3D geostatistical layers that will be exported to an output netCDF file. | Geostatistical Layer |
Output netCDF file
| The output netCDF file containing the exported values from the input geostatistical layers. The results of each geostatistical layer are saved as different variables in the netCDF file. | File |
Export locations
(Optional) | Specifies the locations to export from the Input 3D geostatistical layers parameter value. If you choose the 3D gridded points option, you must provide values for the X spacing, Y spacing, and Elevation spacing parameters that represent the distance between each gridded point in all dimensions. If you choose the Custom 3D points option, you must provide 3D point features in the 3D point locations parameter representing the locations to export.
| String |
X spacing
(Optional) | The spacing between each gridded point in the x-dimension. The default value creates 40 points along the output x-extent. | Linear Unit |
Y spacing
(Optional) | The spacing between each gridded point in the y-dimension. The default value creates 40 points along the output y-extent. | Linear Unit |
Elevation spacing
(Optional) | The spacing between each gridded point in the elevation (z) dimension. The default value creates 40 points along the output z-extent. | Linear Unit |
3D point locations
(Optional) | The 3D point features representing locations to export. The point features must have their elevations stored in the Shape.Z geometry attribute. | Feature Layer |
Output variables
(Optional) | Specifies the output types for the Input 3D geostatistical layers values. You can specify one or more output types for each of the layers or you can apply an output type to all input geostatistical layers. By default, the predictions for all layers will be exported. To export other output types, specify the layer to export (or choose All to specify all layers) in the first entry of the value table. Specify the output type in the second entry of the value table. If you choose Probability or Quantile as the output type, specify the threshold value (for probability) or the quantile value (for quantile) in the third entry of the value table. If you choose Prediction or Prediction standard error as the output type, you can leave the third entry in the value table empty. | Value Table |
Input study area polygons
(Optional) | The polygon features that represent the study area. Only points that are within the study area are saved in the output netCDF file. When visualized as a voxel layer, only voxels within the study area will display in the scene. Points are determined to be inside or outside the study area using only their x- and y-coordinates. | Feature Layer |
Minimum elevation clipping raster (Optional) | The elevation raster that will be used to clip the bottom of the voxel layer. Only voxels above this elevation raster will be assigned predictions. For example, if you use a ground elevation raster, the voxel layer will only display above the ground. It can also be used for bedrock surfaces or the bottom of a shale deposit. The raster must be in a projected coordinate system, and the elevation values must be in the same unit as the vertical unit of the raster. | Raster Layer |
Maximum elevation clipping raster (Optional) | The elevation raster that will be used to clip the top of the voxel layer. Only voxels below this elevation raster will be assigned predictions. For example, if you use a ground elevation raster, the voxel layer will only display below the ground. It can also be used to clip voxels to the top of a restricted airspace. The raster must be in a projected coordinate system, and the elevation values must be in the same unit as the vertical unit of the raster. | Raster Layer |
Derived Output
| Label | Explanation | Data Type |
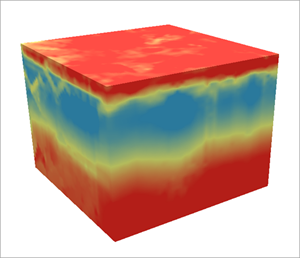
| Output voxel layer | A voxel layer of the predicted values. | Voxel Layer |
