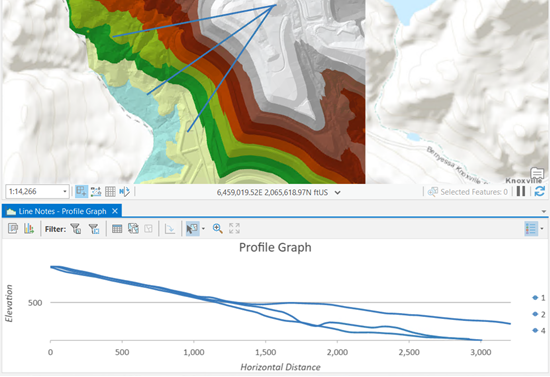
A profile graph is one of the charts available in ArcGIS Pro. Profile graphs are often used to show change in elevation of a surface along one or more lines. Profile graphs can help you assess the difficulty of a trail or evaluate the feasibility of placing a rail line along a given route. You can create profile graphs in ArcGIS Pro from 3D line feature classes, from 3D line features digitized from a surface on a map, or from the output from the Line Of Sight geoprocessing tool.
Note:
A profile graph can be viewed without a 3D Analyst license, but the creation of a profile graph requires a 3D Analyst extension license.
Create a profile graph from 3D lines in a feature class
To create a profile graph in ArcGIS Pro from 3D lines in a feature class, complete the following steps:
- On the Map tab, click the Add Data button
 .
. - Browse to the location of the 3D lines feature class on the Add Data dialog box and click OK to add it to the map.
- Select the 3D lines layer in the Contents pane.
- On the layer's contextual Data tab, in the Visualize group, click the Create Chart button
 .
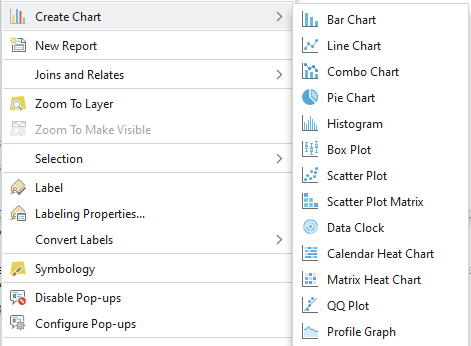
.Alternatively, right-click the layer in the Contents pane and point to Create Chart
 .
. - Click Profile Graph
 .
. - A chart window appears, and a profile graph is drawn in the window.
- The Chart Properties pane appears where you can define the chart properties.
- A new chart is added to the Charts section under the source layer in the Contents pane.

After you choose the type of chart, the following occur:
Create a profile graph from digitized 3D lines on a surface
You can create a profile graph by interactively digitizing line features from a surface in ArcGIS Pro using map notes in a map. Map notes are graphical notations that can be added to a map or scene. When you add map notes, they become individual spatial features in the map, so they remain positioned relative to other map data. Using map notes and a surface, you can add new 3D lines that adhere to a surface.
Note:
This workflow only works in a map.
To create a profile graph from digitized 3D lines on a surface, complete the following steps:
- Add a surface from which to digitize 3D lines.
You can add any surface, such as a raster, TIN, terrain dataset, or LAS dataset (as a TIN).
Alternatively, you can use a surface from ArcGIS Living Atlas of the World by doing the following:
- On the Map tab, click the Add Data drop-down arrow and click Elevation Source.
- On the Add Elevation Source dialog box, select Living Atlas from the list of available portals.
- Click Terrain.
- Click OK to add the surface.
- On the Insert tab, in the Layer Templates group, click Line Map Notes.
A new Line Notes layer is added to the Contents pane. The Line Notes layer behaves as any other layer in ArcGIS Pro. For example, you can change the symbology as you would with any other layer.
- Click the Edit tab.
- Click the Mode drop-down arrow and click the Surface button
 .
. - Click the Create Features button
 to open the Create Features pane.
 - Set the automatic densification to use when the 3D lines are created so they follow the surface by doing the following:
- Right-click the Line tool
 .
. - Click Properties.
- On the Template Properties dialog box, click Tools.
- Check the Densify Lines check box.
- Set a Sample Distance value to use to densify the new lines.
- Click OK.
By default, the surface is sampled only where you digitize vertices, which doesn't capture surface detail between vertices. That's why it's important to turn on densification at a certain interval.
- Right-click the Line tool
- Create 3D lines by doing the following:
- Click the Line tool
 .
. - On the surface, interactively digitize lines that you want to use in a profile graph.
The Line tool
 creates a continuous line feature with multiple vertices.
 For more information on creating line features, see Create polyline features. Another way to create 3D lines that are draped on the surface is to use the Interpolate Shape geoprocessing tool.
- Click the Line tool
- Click Save
 to save the new line features.
 - Create a profile graph by doing the following:
- Select the new 3D lines using a selection tool
 . If you don't select any lines, then all of the lines in the layer will be depicted in the profile graph.
 - Click the layer in the Contents pane.
- On the Data tab, in the Visualize group, click the Create Chart button
 .
. Alternatively, right-click the layer in the Contents pane and click Create Chart
 .
.
- Select the new 3D lines using a selection tool
- Click Profile Graph
 in the list of charts.
A profile graph is drawn based on the selected lines in the newly created layer, or on all of the lines in the layer if there is no selection.

Create a profile graph from output of the Line Of Sight tool
The Line Of Sight geoprocessing tool outputs a feature class of 3D lines that contains SourceOID, VisCode, and TarIsVis fields.
Note:
To display points and a connecting line when graphing the 3D lines that result from running the tool, ensure that the Output graphing attributes parameter is checked.
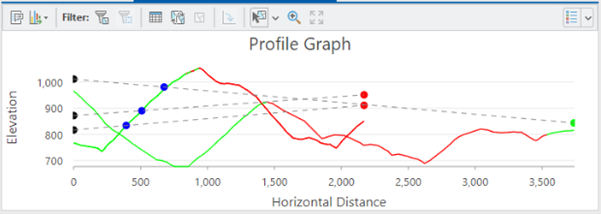
You can create profile graphs in ArcGIS Pro from output of the Line Of Sight tool. The following categories of elements can be displayed in a profile graph:
- Visible and invisible lines starting from the observer point to the target point
- An observer point, target point, and a possible obstruction point
- A dashed line connecting the observer and target points

Note:
When running the Line Of Sight tool, the input sight line feature class may contain an OffsetA field to specify a vertical offset for the observer and an OffsetB field to specify a vertical offset for the target. If you output graphing attributes, these vertical offsets will be taken into account if you display points or a connecting line.
Chain lines together in a profile graph
In order to chain lines together in a profile graph, complete the following steps:
- In the Contents pane, select a layer that has at least some line features that appear to form a path composed of multiple lines with no gaps, or minimal gaps, between them. These could, for instance, be individual line features that together represent the centerline of a road or river.
- Create a profile graph.
- In the Chart Properties pane, in the Data tab, Chaining section, turn on chaining.