You can use a link chart based on a knowledge graph to detect communities to find entities that are closely connected to each other and loosely connected to the entities in other communities. Communities are detected based on the entities that are currently present in the link chart, not on the content in the knowledge graph as a whole.
Community detection algorithms can help you visualize groups of closely related entities that may not be discoverable using other methods of analysis. Communities can show influential groups in a social network, scientific collaborations and research patterns, individuals who are more likely to know each other based on shared connections, and so on.
A community can have one entity as a member. Your analysis can also identify entities that are isolated from the rest of the network.
Methods for calculating communities, customizing method parameters, and exploring the results are described below.
Community detection methods
Six community detection methods are available for link charts based on a knowledge graph: Louvain, Girvan-Newman,
Biconnected, Weakly Connected, Strongly Connected, and Label
Propagation. Select the method from the Detection Method
drop-down list in the Community table view  . Only one method can be used at a time.
Louvain
The Louvain community detection method is a hierarchical clustering algorithm that detects communities in large networks. The method evaluates how densely connected the entities in a community are, and compares the result to how connected the entities would be in a randomized network. This method is the default when the Community table is opened.
If the relationships within a community are more dense than they would be in a random network, the modularity is positive. The modularity increases as relationships are more dense in the communities.
This method first detects small communities by optimizing modularity. Modularity is a measure of the quality of how nodes are divided into communities. If the relationships in a community are more dense than they would be in a random network, the modularity is positive and the entities are placed in a community. The more dense relationships are in a community, the higher the modularity score is.
The process repeats iteratively, evaluating communities of increasing size with random community assignments.
Girvan-Newman
The Girvan-Newman community detection method identifies communities by considering the level of betweenness for the relationships that connect communities to each other. Shortest paths are calculated between all entities in the graph, and the betweenness centrality is calculated for all the traversed relationships. Relationships that connect separate communities have the highest betweenness centrality because they must be traversed the most often to get from one community to another.
The relationship with the highest betweenness centrality is removed, and the process is repeated. As the central relationships are removed, the communities become more distinct. Relationships are iteratively removed until all remaining relationships have the same betweenness centrality.
This process can take a long time for very large link charts.
Biconnected
The Biconnected method finds communities in the network that are connected to each other. Two entities connected by a relationship are part of the same community. Other entities belong to the same community if relationships allow you to go from one entity to another, and if this remains true after removing one of the relationships in the community. Each entity can belong to many communities.
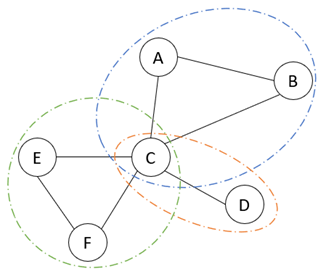
In this example, C is part of all three communities since it has a relationship to entities in each community. The entities A, B, and C form one community because they are each connected to each other, and they remain connected to each other when one of the relationships between them is removed. When the relationship between C and D, or C and E, or C and F is removed, D, E, and F, respectively, are no longer connected to A and B, so they are not part of the A, B, and C community.
Weakly Connected
A weakly connected community is one where all entities are connected to each other by a path. The direction of relationships between entities in the link chart is not considered; that is, the link chart is evaluated as an undirected graph.
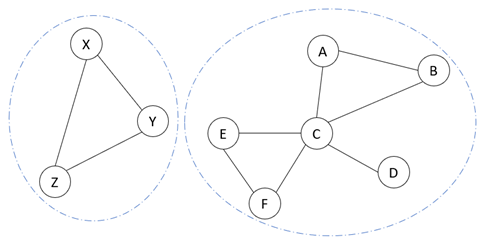
In this example, there are two weakly connected communities. A, B, C, D, E, and F form one community and X, Y, and Z form another community. Each of these communities have relationships that connect all entities. There are no relationships that connect the X, Y, Z community to the A, B, C, D, E, F community.
If every entity in the graph is connected to every other entity in some manner, the entire graph is weakly connected.
Strongly Connected
A strongly connected community is one where all entities in the community are connected to each other when a relationship's direction is considered. That is, the link chart is evaluated as a directed graph.
This means that if you start anywhere in the community and trace a path that respects each relationship's direction, you can reach all entities in the community.
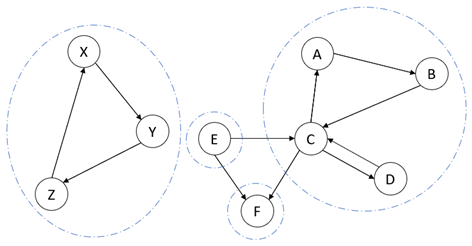
In this example, the X, Y, Z community and the A, B, C, D community are strongly connected because you can start at any entity in either community and follow the directed relationships to reach every other entity.
E and F are their own communities since they are not strongly connected to any other entities. You can reach F from the A, B, C, D community but you cannot reach the larger community from F. Similarly, you can reach the A, B, C, D community from E, but you can't reach E from the larger community.
Label Propagation
The Label Propagation method is an algorithm that determines communities based on the way information moves through the graph. First, entities are assigned a label. Then, an entity selected at random assesses its neighbors and determines which label is used by most of its neighbors. The entity updates its label to match the one that most of its neighbors have. The process of an entity assessing its neighbors and updating its label is repeated again and again.
After several iterations, labels tend to become dominant in densely connected communities and have trouble crossing over to other regions in the graph that are less connected. The more iterations are used, the more chances the labels have to cross from a densely connected community to a weakly connected community. When every node has a label that most of its neighbors have, the algorithm ends even if the specified number of iterations haven't been completed.
The Label Propagation method can produce different sets of communities each time it is used depending on which options are used to perform the analysis. You can change the seed number that is used to initialize a random number generator used by the algorithm, how many solutions are generated, and how many iterations of the algorithm are used to produce each solution.
The Community table presents an aggregate of all solutions produced by several runs. You can see the results of each run by sorting the Community table using the Solution field. By default, 20 solutions are produced. Results from the first run are associated with partition zero, and results from the twentieth run are associated with partition 19 in the table.
Settings are available that allow you to determine some parameters of the Label Propagation method. Click the Options button on the toolbar at the top of the Community table, and click the Label Propagation heading.
Open the Community table
Communities for the entities in a link chart are determined using the Louvain method by default, and described in the
Community table  . Use the Detection Method drop-down list to
evaluate communities using another method instead. All rows in the table will be updated to display properties of the new community
results.
The table has one row for each community. Properties of each community are shown in different fields in the table:
- Solution—Displayed for the Label Propagation method only when the Show solution column option is checked; the option is checked by default. This field provides an identifier for each solution produced by the Label Propagation method.
- Community—For all community detection methods except Label Propagation, this field shows an identifier for the community and is used by default to sort rows in the table. For the Label Propagation method, this column displays a value that identifies a community in one solution produced by this method.
- Count—The number of entities in the community.
- Entity—The display name for each entity in the community. The first five entities are listed by default. If the community includes more than five entities, you can show additional entities by clicking +More at the bottom of the list. Click -Less to show fewer entities.
- Type—The entity type for each entity in the community. Types of the first five entities are listed by default. When more entities are shown in the list, their corresponding entity types are also listed in the Type column. Click +More at the bottom of the Type list to show additional entity types. Click -Less to show fewer entity types.
To view communities for the entities in a link chart, complete the following steps:
- On the Link Chart tab on the ribbon, in the Analyze group, click Community
 .
.
The Community table
 opens. The name that appears on the tab for the Community table view identifies the link chart for which the communities were calculated. The Louvain method is used by default. Rows in the table are sorted using the Community field by default.
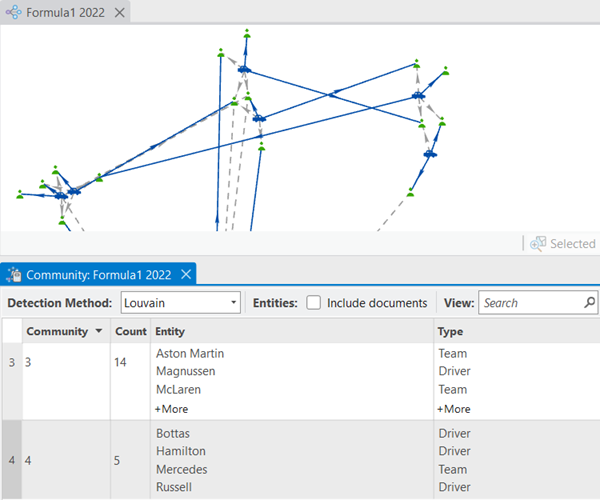
- Click the Detection Method drop-down list and click another method for evaluating communities.
Communities in the link chart are reevaluated and the rows in the table are updated to represent the results.
Include documents
By default, Document entities are not considered when communities are detected even if they are present in the link chart; however, you can include Document entities in the calculations. For example, you can determine whether the documents connected to certain entities also belong to those communities.
- Check or uncheck the Include Documents check box on the toolbar at the top of the Community table.
Checked—Include Document entities when detecting communities. Documents will be considered and included in their respective communities based on the chosen method.
Unchecked—Exclude Document entities when detecting communities. Documents will not be considered or included in communities. This is the default setting.
The Community table is automatically updated to reflect the changes to this setting. Document entities are added to or removed from the table and communities are recalculated automatically.
Identify communities in the link chart
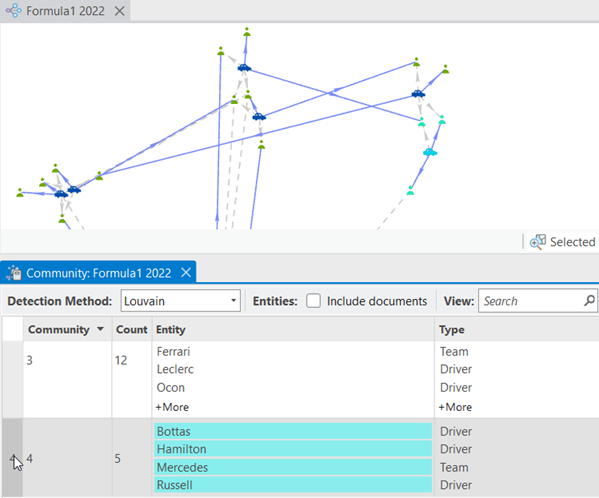
When you select one or more rows in the Community table, all entities in the communities defined by those rows are selected in the Entity field in the table and in the associated link chart. Click the row number, or values in the Community, Count, or Solution fields to select a row in the table.
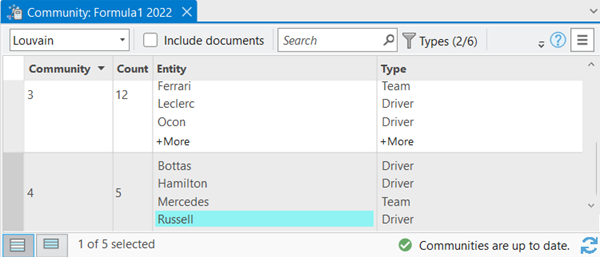
You can click one or more individual entities in the Entity field to select it. Similarly, if you select an entity in the link chart, it is selected in the Entity field in the corresponding Community table. With the Label Propagation detection method, an entity can appear in more than one row in the Community table and is selected in all rows in which it appears.
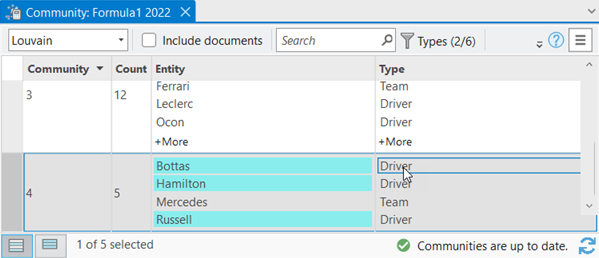
You can click an entity type in the Type field to select all entities of that type in the community.
- Click a row in the Community table to select the entities in that community.
The corresponding entities are selected in the Entity field and in the link chart.
- Click a type in the Type field to select all entities of that type in a community.
The corresponding entities are selected in the Entity field and in the link chart.
- Click an entity in the Entity field to select it.
The entity is selected in the Entity field and in the link chart.
- Click +More at the bottom of the list of entities in the Entity field or at the bottom of the list of types in the Type field to see all entities and types in a community.
- Click -Less at the bottom of the list of entities in the Entity field or at the bottom of the list of types in the Type field to see fewer entities and types in a community.
Search the Community table for an entity
It may not be obvious which community includes an entity of interest. You can search for an entity to select it in the Community table view.
- Click in the search text box on the toolbar at the top of the Community table.
- Type the display name of an entity in the link chart.
The rows in the Community table are automatically filtered to show only the entities whose display name matches the name you typed. Only rows representing the filtered entities are displayed in the table.
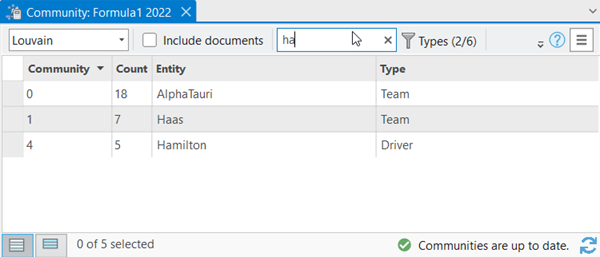
- Select the community containing the entity in which you are interested.
- Click the Delete button
 in the search text box to clear the search and see all rows in the Community table.
All entities in the community are visible and remain selected. All communities are visible in the table.
Filter the types of entities shown in the Community table
By default, the Community table includes all entity types in the link chart. For large link charts, the table can show too much information to process. You can filter the types displayed in the table to show only specific entity types in their respective communities.
- Click the Types button
 on the toolbar at the top of the Community table.
A drop-down list appears that includes all entity types in the knowledge graph even if entities of that type are not in the link chart. All entity types are checked by default.
- In the drop-down list, check the entity types you want in the Community table. Uncheck entity types you do not want in the table. Type the name of an entity type if you don't see it in the list; the list of entity types is filtered automatically, and you can check or uncheck entity types in the filtered list.
The total number of selected entity types appears on the toolbar next to the Types button.
The entities in the Community table are updated automatically. Entities associated with the checked entity types appear in the table. Entities associated with the unchecked entity types are removed from the table.
Recalculate communities
When you initially open the Community table for a link chart, communities are detected and a message appears at the bottom of the table indicating the communities are up to date.
After adding or deleting entities and relationships in a link chart, previously detected communities may no longer reflect the link chart's content. The Community table will show a message at the bottom indicating the communities are out of date.
- At the bottom of the Community table view, click the Refresh button
 .
.All rows are removed from the Community table and new communities are recalculated.
The message at the bottom of the table indicates that the communities are up to date.
Set Label Propagation options
The Label Propagation method allows you some control over the process of detecting communities in the link chart.
You can determine how many solutions are produced by this method and how many iterations are used to develop each solution. Also, a seed number can be provided to initialize a random number generator that is used in the algorithm. With different seed values, different solutions can be produced.
After choosing the settings in the Options panel, update the Community table to recalculate the communities.
- Click the Options button
 on the toolbar at the top of the Community table.
The Options panel appears.
- In the Options panel, click the Label Propagation heading to view the available settings.
- In the Seed for random number generator text box, type a value.
The default setting is zero.
- In the Number of solutions text box, type the number of times the algorithm will be run to generate a set of communities for the link chart.
The default setting is 1.
When Number of solutions is 1, one set of communities is generated for the link chart. These communities are associated with the value zero in the Solution field. When Number of solutions is 10, 10 sets of communities are generated for the link chart, and the communities for the tenth run are associated with the value nine in the Solution field.
- In the Number of iterations text box, type the maximum number of iterations to use to determine the final set of communities for one solution produced by the Label Propagation algorithm.
The default setting is 1,000.
- The Show solution column check box allows you to choose whether the communities found can be sorted to evaluate the solution produced by each run or the algorithm.
- Checked—Show the Solution field. This is the default.
- Unchecked—Do not show the Solution field.
- In the lower right corner of the Community table view, click the Refresh button
 to see updated results.