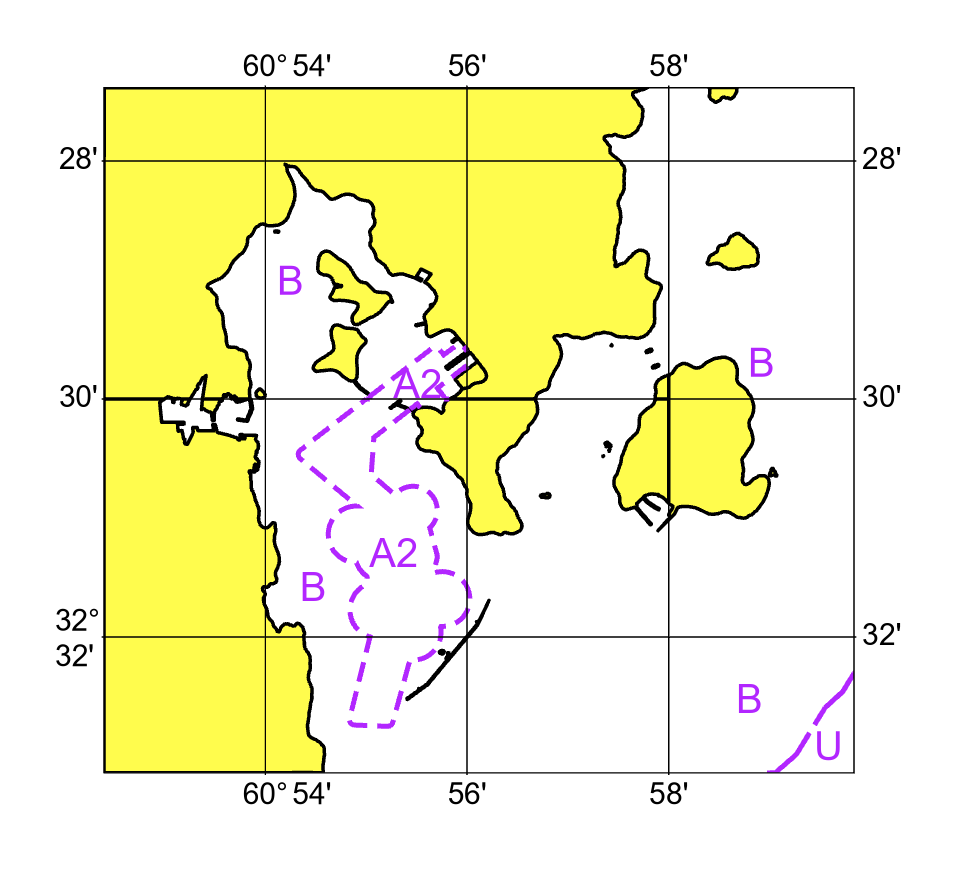
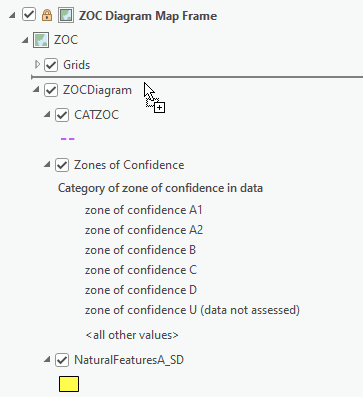
The S-4 chart specification of the International Hydrographic Organization (IHO) defines Zones of Confidence (ZOC) diagrams as a type of source diagram that provides a qualitative assessment of the source information. As with source diagrams, ZOC diagrams allow mariners to assess the quality of the hydrographic data used to compile the chart.

You can use the Create ZOC Diagram tool to create a ZOC diagram. This tool is in the Paper Charting toolbox, available with the ArcGIS Maritime product data files. Once the product files are installed, add the toolbox to an ArcGIS Pro project. The toolbox file is located at <installation location>\ArcGIS Maritime\Product Files\<version>\Charting\Tools.
To create a ZOC diagram, complete the following steps:
- Start ArcGIS Pro.
- Open a new or existing project.
- Create a layout that contains a map frame for the chart and another map frame for the ZOC diagram.
- In the Contents pane, rename the chart and diagram map frames:
- Select the map frame you created for the chart and click the name of the map frame to rename it.
For example, you can name it Chart Map Frame.
- Select the map frame you created for the ZOC diagram and click the name of the map frame to rename it.
For example, you can name it ZOC Diagram Map Frame.
- Select the map frame you created for the chart and click the name of the map frame to rename it.
- Install the Paper Charting toolbox.
- In the Catalog pane, click the Project tab, and expand Toolboxes.
- Expand PaperCharting.atbx, and double-click Create ZOC Diagram.
The Create ZOC Diagram tool opens in the Geoprocessing pane.
- For the Project Type parameter, choose CURRENT_APRX to use a chart in the active project or PATH_TO_APRX to reference a chart from another project.
It is recommended that the tool is run on the active project.
Tip:
Choose PATH_TO_APRX if you want to run the tool as part of a script.
- If you chose PATH_TO_APRX in the previous step, click Browse
 next to Project File and browse to the location of the project.
 - For the Chart Database parameter, choose a chart database.
- Click the Layout drop-down arrow and choose a layout.
- Provide the name of the ZOC diagram map frame in the Map Frame text box or choose one from the drop-down list.
- For the Area of Interest parameter, do one of the following to set the area of interest (AOI):
If the AOI layer is in the active map, click the Area of Interest drop-down arrow and choose the layer. If the chosen layer contains more than one polygon feature, select the polygon feature that you want to use.
When a polygon feature is selected, the Use the selected records: 1 toggle button appears below the Area of Interest parameter and is automatically turned on.

Click Browse
 next to Area of Interest and browse to the location of the polygon feature class that you want to use. The polygon feature class must only contain a single polygon feature.
- Provide a value for the ZOC Diagram Scale parameter that represents the scale at which the ZOC diagram will be created.
A ZOC diagram scale is typically one-tenth of the scale of the chart. If the chart is 1:10,000, the ZOC Diagram Scale parameter value would be 100000.
- For the ZOC Layer File parameter, browse to <installation location>\ArcGIS Maritime\Product Files\<version>\Charting\Symbols and choose the ZOCDiagram.lyrx file.
The ZOCDiagram.lyrx layer file contains ZOC-specific symbology and labeling configuration information. You can configure this file to meet your organization's specific needs if necessary.
- Optionally, choose an .xml file that contains ZOC grid definitions for the Grid XML File parameter.
If the Grid XML File parameter is left blank, the grid .xml file that matches the ZOC diagram scale is used.
Note:
Preconfigured ZOC grid .xml files are included with the Maritime product files at <installation location>\ArcGIS Maritime\Product Files\<version>\Charting\GridDefinitions.
- Optionally, provide a value for the Coordinate System parameter by doing one of the following:
- Click the Primary Coordinate System drop-down arrow and choose the coordinate system of the active map.
- Click the Select coordinate system button
 and choose an appropriate coordinate system from the XY Coordinate Systems Available list.
Note:
If no coordinate system is specified, the projection of the grid XML is used. The standard parallel is calculated based on the chart extent.
- Click Run.
A ZOC diagram is created and added to the chosen map frame in the layout.
If the tool was run with PATH_TO_APRX as the project type, open the project that the ZOC diagram was generated in, right-click the Grids layer in the Contents pane, and choose Zoom to layer to center the AOI in the diagram.
Add an annotation layer to the ZOC diagram
The Create ZOC Diagram tool creates an annotation feature class for the Category of Zone of Confidence in Data (CATZOC) values. The quality of the hydrographic source data is assessed according to six categories: five quality categories for assessed data (A1, A2, B, C, and D) and a sixth category (U) for data that has not been assessed. These category values are stored in the Category of Zone of Confidence in Data (CATZOC) attribute of the M_QUAL_QualityOfData subtype, in the MetaDataA feature class. To display the category values in the ZOC diagram, the Create ZOC Diagram tool does the following:
- Labels M_QUAL areas with the appropriate zone of confidence assessment value from the CATZOC attribute
- Converts CATZOC labels to annotation features
To add the annotation layer to the ZOC diagram, complete the following steps:
- Open the layout that contains the ZOC diagram.
- In the Catalog pane, expand the chart database that was used to create the ZOC diagram.
- Click the Zones_of_ConfidenceAnno<scale> annotation feature class, and drag it into the Contents pane, placing the layer in the map frame for the ZOC diagram, below the Grids group layer.

The annotation layer is added to the ZOC diagram.