Available with Location Referencing license.
Characteristics of a route, such as speed limit or functional class, can be represented as a line event by providing x-, y-, or optionally, z-coordinate locations as the basis for measure location. The coordinate data is stored as routes and measures.
The coordinates method appears as an optional method in the Add Line Event and Add Multiple Line Events tools. To add line events, choose the Coordinates method and provide the x-, y-, and optionally, z-coordinates.
Add a line event by coordinates
Complete the following steps using the Add Line Event tool to create a single line event by coordinates:
- Open the map in ArcGIS Pro and zoom to the location where you want to add the line event.
- On the Location Referencing tab, in the Events group, click Add > Line Event
 .
.The Add Line Event pane appears with the default Route and Measure value.
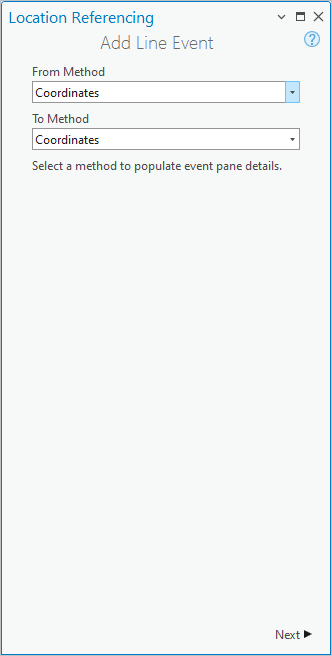
- Click the From Method drop-down arrow and choose Coordinates.
- Click the To Method drop-down arrow and choose Coordinates.
Using the coordinates method, the measure location is based on geographic coordinates.
Tip:
You can use a combination of any of the methods to locate the start measure and end measure values. For example, you can use Route and Measure to choose the start measure value, and use Coordinates to define the end location on the map.
The methods you choose appear in the from and to section labels. For example, From: Route and Measure and To: Coordinates appear if the start method is Route and Measure and the end method is Coordinates.
- Click Next.
The Event Layer and Network options and the From: Coordinates and To: Coordinates sections appear in the Add Line Event pane.
- Click the Event Layer drop-down arrow and choose the event layer where the events will be added.
The parent LRS Network is populated based on the Event Layer value.
- Specify the route in the From: Coordinates section by doing one of the following:
- Provide the route ID in the Route ID text box.
- Click Choose route from map
 and click the route on the map.
The specified route is highlighted in light blue.
Note:
If a message appears that is related to acquiring locks, the need to reconcile, or not being able to acquire locks, ArcGIS Roads and Highways conflict prevention is enabled.
- Optionally, in the From: Coordinates section, provide a geographic coordinate factor value in the GC Factor text box.
- In the From: Coordinates section, click the Spatial Reference drop-down arrow and choose a spatial reference.
- LRS Spatial Reference—The spatial reference of the LRS network
- Web Map Spatial Reference—The spatial reference of the basemap
- GCS_WGS_1984—A geographic spatial reference using degree decimals as units
Note:
Choosing GCS_WGS_1984 provides Longitude, Latitude, and Height options rather than X, Y, and Z options.
- In the From: Coordinates section, provide coordinate values for X, Y, and optionally, Z, for the start location.
A green square is placed at the specified coordinate on the map for the start location.
A green dot appears on the route at the location nearest to the green square. This is the location of the start measure value of the event.
Tip:
Click Choose measure from map
 and click the location on the map.
The route measure closest to the original coordinates is selected and its distance from the route is displayed.
- In the To: Coordinates section, provide coordinate values for X, Y, and optionally, Z, for the to location.
A red square is placed at the specified coordinate on the map for the end location.
A red dot appears at the measure on the route to which the coordinate values correspond. This is the location of the end measure value for the event.
Tip:
Click Choose measure from map
 and click the location on the map.
The route measure closest to the original coordinates is selected and its distance from the route is displayed.
- Specify the date that defines the start date of the event by doing one of the following:
- Provide the start date in the Start Date text box.
- Click Calendar
 and choose the start date.
 - Check the Route start date check box.
Note:
The start date cannot be before the start date of the selected route.
The start date default value is the current date, but you can choose a different date.
- Optionally, specify the date that defines the end date of the event by doing one of the following:
- Provide the end date in the End Date text box.
- Click Calendar
 and choose the end date.
 - Check the Route end date check box.
If no end date is provided, the event remains valid from the route start date and into the future.
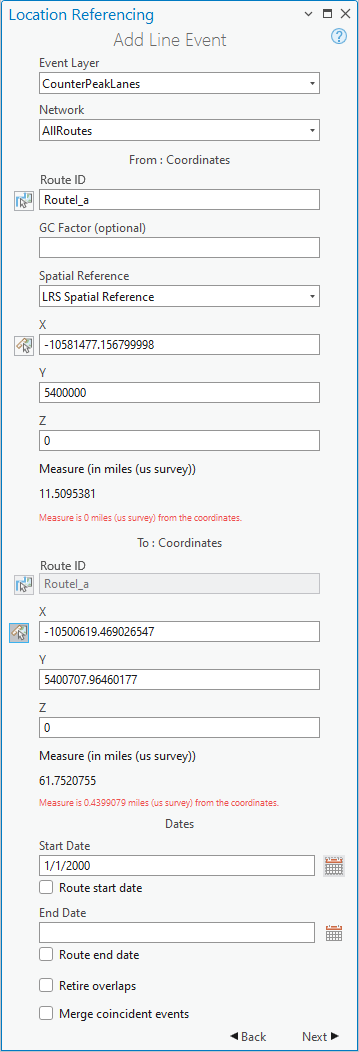
- Choose a data validation option to prevent erroneous input while characterizing a route with line events.
- Retire overlaps—The measure, start date, and end date of existing events are
adjusted to prevent overlaps with respect to time and measure
values once the new line event or events are created.
Learn more about retiring overlaps
- Merge coincident events—When all attribute values for a new event are the same as an existing event, and if the new event is adjacent to or overlapping an existing event in terms of its measure values, and its time slices are coincident or overlapping, the new event is merged with the existing event and the measure range is expanded accordingly. For more information and examples, refer to the Merge coincident events scenarios section below.
- Retire overlaps—The measure, start date, and end date of existing events are
adjusted to prevent overlaps with respect to time and measure
values once the new line event or events are created.
- Click Next.
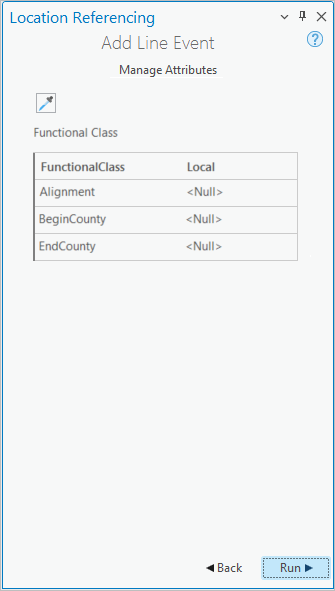
- Provide attribute information for the new event.
Note:
Click Copy attribute values by selecting event on the map
 and click an existing line event belonging to the same event layer on the map to copy event attributes from that event.
 - Click Run.
A confirmation message appears when the line event is added and appears on the map.
Add multiple line events by coordinates
Complete the following steps using the Add Multiple Line Events tool to create multiple line events using coordinates:
- Open the map in ArcGIS Pro and zoom to the location where you want to add the line events.
- On the Location Referencing tab, in the Events group, click Add > Multiple Line Events
 .
.The Add Multiple Line Events pane appears with the default Route and Measure value.
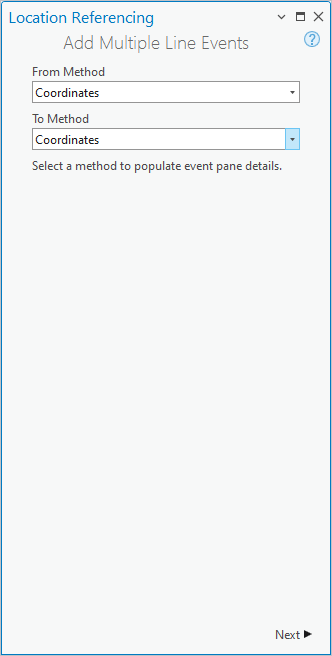
- Click the From Method drop-down arrow and choose Coordinates.
- Click the To Method drop-down arrow and choose Coordinates.
Tip:
You can use a combination of any of the methods to locate the start measure and end measure values. For example, you can use Route and Measure to choose the start measure value, and use Coordinates to define the end location on the map.
The methods you choose appear in the from and to section labels. For example, From: Route and Measure and To: Coordinates appear if the chosen start method is Route and Measure and the chosen end method is Coordinates.
- Click Next.
The Network drop-down menu, and the From: Coordinates and To: Coordinates sections appear in the pane.
- Click the Network drop-down arrow and choose a network.
- In the From: Coordinates section, specify the route on which the events will be located by doing one of the following:
- Provide the route ID on which the new event measure will be based in the Route ID text box.
- Click Choose route from map
 and click the route on the map.
The line is highlighted in light blue.
Note:
If a message appears that is related to acquiring locks, the need to reconcile, or not being able to acquire locks, conflict prevention is enabled.
- Optionally, in the From: Coordinates section, provide a geographic coordinate factor value in the GC Factor text box.
- In the From: Coordinates section, click the Spatial Reference drop-down arrow and choose a spatial reference.
- LRS Spatial Reference—The spatial reference of the LRS network
- Web Map Spatial Reference—The spatial reference of the basemap
- GCS_WGS_1984—A geographic spatial reference using degree decimals as units
- In the From: Coordinates section, provide coordinate values for X, Y, and optionally, Z, for the starting location.
A green square is placed at the specified coordinate on the map for the starting location.
A green dot appears on the route at the location nearest to the green square. This is the location of the starting measure of the event.
Tip:
Click Choose measure from map
 and click the location on the route.
The route measure closest to the original coordinates is selected and its distance from the route is displayed.
- In the To: Coordinates section, provide coordinate values for X, Y, and optionally, Z, for the end location.
A red square is placed at the specified coordinate on the map for the end location.
A red dot appears at the measure on the route to which the coordinate values correspond. This is the location of the end measure value for the event.
Tip:
Click Choose measure from map
 and click the location on the route.
The route measure closest to the original coordinates is selected and its distance from the route is displayed.
- Specify the date that defines the start date of the events by doing one of the following:
- Provide the start date in the Start Date text box.
- Click Calendar
 and choose the start date.
 - Check the Route start date check box.
Note:
The start date cannot be before the start date of the selected route.
The start date default value is today's date, but you can choose a different date.
- Optionally, specify the date that defines the end date of the events by doing one of the following:
- Provide the end date in the End Date text box.
- Click Calendar
 and choose the end date.
 - Check the Route end date check box.
The end date is optional. If no end date is provided, the event remains valid from the event start date into the future.

- Choose a data validation option to prevent erroneous input while characterizing a route with line events.
- Retire overlaps—The measure, start date, and end date of existing events are
adjusted to prevent overlaps with respect to time and measure
values once the new line event or events are created.
For more information and examples, refer to the Retire overlaps scenarios section below.
- Merge coincident events—When all attribute values for a new event are the same as an existing event, and if the new event is adjacent to or overlapping an existing event in terms of its measure values, and its time slices are coincident or overlapping, the new event is merged with the existing event and the measure range is expanded accordingly. For more information and examples, refer to the Merge coincident events scenarios section below.
- Retire overlaps—The measure, start date, and end date of existing events are
adjusted to prevent overlaps with respect to time and measure
values once the new line event or events are created.
For more information and examples, refer to the Retire overlaps scenarios section below.
- Click Next.
Manage Attributes appears with the default attribute set.
The Attribute Set drop-down menu includes other attribute sets if configured.
You can configure attribute sets for yourself and for others in the same feature service.
- Optionally, click the Attribute Set drop-down arrow and choose an attribute set.
The Attribute Set drop-down menu includes other attribute sets if configured.
- Provide attribute information for the new events.
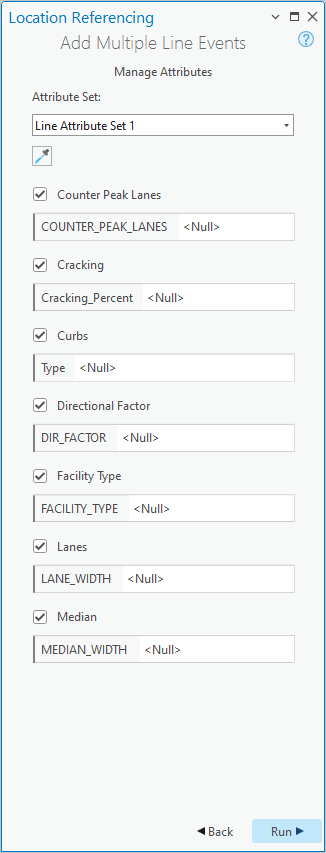
Note:
Click Copy attribute values by selecting event on the map
 and click an existing line event belonging to the same event layer on the map to copy event attributes from that event.
 - Click Run.
A confirmation message appears when the line events are added and appear on the map.
Referent offset when using the Coordinates method
The Roads and Highways events data model supports the configuration of referent fields and their enablement using the Enable Referent Fields tool. Once referent fields are configured and enabled in a layer, referent locations are populated and persisted in that layer when events are added or edited.
When line events are created using the Coordinates method in a referent-enabled layer, X/Y is used as the FromRefMethod and ToRefMethod field values, the geographic coordinates are used as the FromRefLocation and ToRefLocation field values, and the FromRefOffset and ToRefOffset fields are populated with 0.
The examples below demonstrate the impact of adding line event records that have referent values enabled.
Before adding a line event with referents
The following diagram shows Route1 before event creation:
The following table provides details about the route:
| Route ID | From Date | To Date |
|---|---|---|
Route1 | 1/1/2000 | <Null> |
After adding a line event with referents
The following diagram shows Event1 after event creation:
The following table provides details about the event referent fields in Event1 after event creation:
| FromRefMethod | FromRefLocation | FromRefOffset | ToRefMethod | ToRefLocation | ToRefOffset |
|---|---|---|---|---|---|
X/Y | 33.984980, -117.306397, 20 | 0 | X/Y | 33.965456, -117.265669, 20 | 0 |
The following table provides details about the default event record fields after event location:
| Event ID | From Date | To Date | From Measure | To Measure |
|---|---|---|---|---|
Event1 | 1/1/2000 | <Null> | 12.64 | 14.91 |
You can edit the event using the attribute table so that it uses referents other than the default values. If subsequent route edits are made, the RefMethod and RefLocation values revert to the parent LRS Network and the route, respectively.
Before adding multiple line events with referents
When events are created using the Coordinates method in a referent-enabled layer, X/Y is used as the FromRefMethod and ToRefMethod values, the geographic coordinates are used as the FromRefLocation and ToRefLocation values, and the FromRefOffset and ToRefOffset fields are populated with 0.
The following diagram shows Route1 before event creation:
The following table provides details about the route:
| Route ID | From Date | To Date |
|---|---|---|
Route1 | 1/1/2000 | <Null> |
After adding multiple line events with referents
The following diagram shows multiple line events that have referents enabled:
The following table provides details about the Event1 event referent fields after event creation:
| FromRefMethod | FromRefLocation | FromRefOffset | FromRefMethod | ToRefLocation | ToRefOffset |
|---|---|---|---|---|---|
X/Y | 34.071192, -117.191739, 20 | 0 | X/Y | 33.998575, -117.342102, 20 | 0 |
The following tables provide details about the default event fields after event creation:
CounterPeakLanes
| Event ID | From Date | To Date | From Measure | To Measure | FromRefOffset | ToRefOffset |
|---|---|---|---|---|---|---|
Event1 | 1/1/2000 | <Null> | 12.64 | 14.91 | 0 | 0 |
CrackingPercent
| Event ID | From Date | To Date | From Measure | To Measure | FromRefOffset | ToRefOffset |
|---|---|---|---|---|---|---|
Event1 | 1/1/2000 | <Null> | 12.64 | 14.91 | 0 | 0 |
DirectionalFactor
| Event ID | From Date | To Date | From Measure | To Measure | FromRefOffset | ToRefOffset |
|---|---|---|---|---|---|---|
Event1 | 1/1/2000 | <Null> | 12.64 | 14.91 | 0 | 0 |
Note:
If the route changes in subsequent edits, such as with reassignment, the RefLocation value changes as well.
You can edit the event using the attribute table so that it uses referents other than the default values. If subsequent route edits are made, the RefMethod and RefLocation values revert to the parent LRS Network and the route, respectively.
Retire overlaps scenarios
The examples below demonstrate adding line events that overlap when the Retire overlaps check box is checked.
Single event scenario
In this example, Route1 has an existing Speed Limit event that has dates from 1/1/2000 to <Null>. The impact of adding a second Speed Limit event with overlapping measures is demonstrated.
The following diagram shows the route and the existing event:
The following table provides details about the custom values for EventA before the edit:
| Event ID | Event Layer | Speed |
|---|---|---|
Event A | Speed Limit | 65 |
The following table provides details about the default field values for EventA before the edit:
| Event ID | Route Name | From Measure | To Measure | From Date | To Date |
|---|---|---|---|---|---|
EventA | Route1 | 3 | 7 | 1/1/2000 | <Null> |
The following diagram shows the route and a second event that is added with dates from 1/1/2005 to <Null>:
The following table provides details about the custom values for EventB:
| Event ID | Event Layer | Speed |
|---|---|---|
EventB | Speed Limit | 45 |
The following table provides details about the default field values for EventB after the edit:
| Event ID | Route Name | From Measure | To Measure | From Date | To Date |
|---|---|---|---|---|---|
EventB | Route1 | 5 | 7 | 1/1/2005 | <Null> |
The following diagram shows the impact of checking the Retire Overlaps check box on the route and both events:
The following table provides details about the custom values for both events after event creation:
Tip:
EventA has two event records with identical custom values with different dates (and different from and to measures).
| Event ID | Event Layer | Speed |
|---|---|---|
EventA | Speed Limit | 65 |
EventB | Speed Limit | 45 |
The following table provides details about the default values after retire overlaps is applied:
| Event ID | Route Name | From Measure | To Measure | From Date | To Date |
|---|---|---|---|---|---|
EventA | Route1 | 3 | 7 | 1/1/2000 | 1/1/2005 |
EventA | Route1 | 3 | 5 | 1/1/2005 | <Null> |
EventB | Route1 | 5 | 7 | 1/1/2005 | <Null> |
Multiple events scenario
In this example, Route1 has two existing events, a Speed Limit event and a Parking event, both of which have dates from 1/1/2000 to <Null>. The impact of adding a second pair of events in the same event layers that have overlapping measures is demonstrated.
The following diagram shows the route and the existing events:
The following table provides details about custom values for EventA and EventC. The Speed Limit layer has the custom fields Speed and Units, and the Parking layer has the custom fields Side and Type.
| Event ID | Event Layer | Custom Value 1 | Custom Value 2 |
|---|---|---|---|
EventA | Speed Limit | 65 | Miles per hour |
EventC | Parking | Left Only | Diagonal |
The following table provides details about the default field values for EventA and EventC before the edit:
| Event ID | Route Name | From Measure | To Measure | From Date | To Date |
|---|---|---|---|---|---|
EventA | Route1 | 3 | 7 | 1/1/2000 | <Null> |
EventC | Route1 | 2 | 7 | 1/1/2000 | <Null> |
The following diagram shows the route and two new events in the same event layers that are added with dates from 1/1/2005 to <Null>:
The following table provides details about the custom values for EventB and EventD:
| Event ID | Event Layer | Custom Value 1 | Custom Value 2 |
|---|---|---|---|
EventB | Speed Limit | 45 | Miles per hour |
EventD | Parking | Both | Parallel |
The following table provides details about the default field values for EventB and EventD:
| Event ID | Route Name | From Measure | To Measure | From Date | To Date |
|---|---|---|---|---|---|
EventB | Route1 | 5 | 7 | 1/1/2005 | <Null> |
EventD | Route1 | 5 | 7 | 1/1/2005 | <Null> |
The following diagram shows the route and events after retire overlaps has been applied:
The following table provides details about custom values for EventA and EventB in Speed Limit, as well as EventC and EventD in Parking. Each event layer has two custom fields: Speed Limit has the custom fields Speed and Units, and Parking has the custom fields Side and Type.
Tip:
Each event has multiple custom fields whose values are shown in the Custom Value 1 and Custom Value 2 columns in the following table. Values in these columns correspond to the Event Layer value in the same row.
| Event ID | Event Layer | Custom Value 1 | Custom Value 2 |
|---|---|---|---|
EventA | Speed Limit | 65 | Miles per hour |
EventB | Speed Limit | 45 | Miles per hour |
EventC | Parking | Left Only | Diagonal |
EventD | Parking | Both | Parallel |
The following table provides details about the default values after retire overlaps is applied:
| Event ID | Route Name | From Measure | To Measure | From Date | To Date |
|---|---|---|---|---|---|
EventA | Route1 | 3 | 7 | 1/1/2000 | 1/1/2005 |
EventC | Route1 | 2 | 7 | 1/1/2000 | 1/1/2005 |
EventA | Route1 | 3 | 5 | 1/1/2005 | <Null> |
EventC | Route1 | 2 | 5 | 1/1/2005 | <Null> |
EventB | Route1 | 5 | 7 | 1/1/2005 | <Null> |
EventD | Route1 | 5 | 7 | 1/1/2005 | <Null> |
Merge coincident events scenarios
The examples below demonstrate adding line events that have coincident measures when the Merge coincident events check box is checked.
Single event scenario
In this example, Route1 has an existing Speed Limit event that has dates from 1/1/2000 to <Null>. It demonstrates the impact of adding a Speed Limit event that has coincident measures when Merge coincident events is checked.
The following diagram shows the route and the existing event:
The following table provides details about the custom values for EventA:
| Event ID | Event Layer | Speed |
|---|---|---|
Event A | Speed Limit | 65 |
The following table provides details about the default field values for EventA before the edit:
| Event ID | Route Name | From Measure | To Measure | From Date | To Date |
|---|---|---|---|---|---|
EventA | Route1 | 0 | 4 | 1/1/2000 | <Null> |
The following diagram shows the route and a second event that is added with dates from 1/1/2000 to <Null>:
The following table provides details about the custom values for the new input:
| Event ID | Event Layer | Speed |
|---|---|---|
[NewEvent input] | Speed Limit | 65 |
The following table provides details about the default field values for the new input:
| Event ID | Route Name | From Measure | To Measure | From Date | To Date |
|---|---|---|---|---|---|
[NewEvent input] | Route1 | 4 | 8 | 1/1/2000 | <Null> |
The following diagram shows the impact of checking the Merge coincident events check box when adding the new event:
The following table provides details about the custom values for the event after event creation:
| Event ID | Event Layer | Speed |
|---|---|---|
EventA | Speed Limit | 65 |
The following table provides details about the default values after the new event measures are merged with EventA:
| Event ID | Route Name | From Measure | To Measure | From Date | To Date |
|---|---|---|---|---|---|
EventA | Route1 | 0 | 8 | 1/1/2000 | <Null> |
Multiple events scenario
In this example, Route1 has two existing events, a Speed Limit event (EventA) and a Parking event (EventB), both of which have dates from 1/1/2000 to <Null>. It demonstrates the impact of adding a second pair of events that have coincident measures in the same event layers, but different start and end dates.
The following diagram shows the route and the existing events:
The following table provides details about custom values for EventA and EventB before the edit. The Speed Limit layer has the custom field Speed with the value 65, and the Parking layer has the custom field Side with the value Left Only.
| Event ID | Event Layer | Custom Value 1 |
|---|---|---|
EventA | Speed Limit | 65 |
EventB | Parking | Left Only |
The following table provides details about the default field values for EventA and EventB before the edit:
| Event ID | Route Name | From Measure | To Measure | From Date | To Date |
|---|---|---|---|---|---|
EventA | Route1 | 0 | 4 | 1/1/2000 | <Null> |
EventB | Route1 | 0 | 5 | 1/1/2000 | <Null> |
The following diagram shows the route and input for the new events that are added with dates from 1/1/2005 to <Null>:
The following table provides details about the custom values in the new event inputs:
| Event ID | Event Layer | Custom Value |
|---|---|---|
[NewEvent1 input] | Speed Limit | 65 |
[NewEvent2 input] | Parking | Left Only |
The following table provides details about the default field values in the new event inputs:
| Event ID | Route Name | From Measure | To Measure | From Date | To Date |
|---|---|---|---|---|---|
[NewEvent1] | Route1 | 4 | 8 | 1/1/2005 | <Null> |
[NewEvent2] | Route1 | 4 | 8 | 1/1/2005 | <Null> |
The following diagram shows the route and events after the new events have been merged based on the coincident measures. In this case, the dates result in a new event record, or new time slice, for the existing events with the updated measures.
The following table provides details about custom values for EventA in Speed Limit and EventB in Parking. Speed Limit has two event records with the Speed value, 65. Parking also has two event records with the custom Side value, Left Only.
| Event ID | Event Layer | Custom Value |
|---|---|---|
EventA | Speed Limit | 65 |
EventA | Speed Limit | 65 |
EventB | Parking | Left Only |
EventB | Parking | Left Only |
The following table provides details about the default values after events are merged:
| Event ID | Route Name | From Measure | To Measure | From Date | To Date |
|---|---|---|---|---|---|
EventA | Route1 | 0 | 4 | 1/1/2000 | 1/1/2005 |
EventA | Route1 | 0 | 8 | 1/1/2005 | <Null> |
EventB | Route1 | 0 | 5 | 1/1/2000 | 1/1/2005 |
EventB | Route1 | 0 | 8 | 1/1/2005 | <Null> |