CIMChartGeneralProperties Class
In This Topic
Provides access to members that control general chart properties.
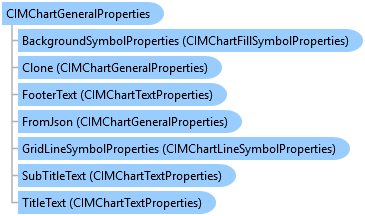
Object Model
Syntax
public class CIMChartGeneralProperties : CIMObject, System.ComponentModel.INotifyPropertyChanged, System.Xml.Serialization.IXmlSerializable
Public Class CIMChartGeneralProperties
   Inherits CIMObject
   Implements System.ComponentModel.INotifyPropertyChanged, System.Xml.Serialization.IXmlSerializable
Example
Create a simple scatter plot
// For more information on the chart CIM specification:
// https://github.com/Esri/cim-spec/blob/main/docs/v3/CIMCharts.md

// Define fields names used in chart parameters.
const string xField = "minimum_nights";
const string yField = "price";

var lyrsScatter = MapView.Active.Map.GetLayersAsFlattenedList().OfType<FeatureLayer>();
var lyrScatter = lyrsScatter.First();
var lyrDefScatter = lyrScatter.GetDefinition();

// Define scatter plot CIM properties
var scatterPlot = new CIMChart
{
    Name = "scatterPlot",
    GeneralProperties = new CIMChartGeneralProperties
    {
        Title = $"{xField} vs. {yField}",
        UseAutomaticTitle = false
    },
    Series = new CIMChartSeries[]
    {
    new CIMChartScatterSeries {
        UniqueName = "scatterPlotSeries",
        Name = "scatterPlotSeries",
        // Specify the X and Y field names
        Fields = new string[] { xField , yField },
        // Turn on trend line
        ShowTrendLine = true
    }
    }
};

// Add new chart to layer's existing list of charts (if any exist)
var newChartsScatter = new CIMChart[] { scatterPlot };
var allChartsScatter = (lyrDefScatter == null) ? newChartsScatter : lyrDefScatter.Charts.Concat(newChartsScatter);
// Add CIM chart to layer defintion
lyrDefScatter.Charts = allChartsScatter.ToArray();
lyrScatter.SetDefinition(lyrDefScatter);
Create a line chart with custom time binning and style
// For more information on the chart CIM specification:
// https://github.com/Esri/cim-spec/blob/main/docs/v3/CIMCharts.md

// Define fields names used in chart parameters.
const string dateField = "last_review";
const string numericField = "price";

var lyrsLine = MapView.Active.Map.GetLayersAsFlattenedList().OfType<FeatureLayer>();
var lyrLine = lyrsLine.First();
var lyrDefLine = lyrLine.GetDefinition();

// Define line chart CIM properties
var lineChart = new CIMChart
{
    Name = "lineChart",
    GeneralProperties = new CIMChartGeneralProperties
    {
        Title = $"Line chart for {dateField} summarized by {numericField}",
        UseAutomaticTitle = false
    },
    Series = new CIMChartSeries[]
    {
    new CIMChartLineSeries {
        UniqueName = "lineChartSeries",
        Name = $"Sum({numericField})",
        // Specify date field and numeric field
        Fields = new string[] { dateField, numericField },
        // Specify aggregation type
        FieldAggregation = new string[] { string.Empty, "SUM" },
        // Specify custom time bin of 6 months
        TimeAggregationType = ChartTimeAggregationType.EqualIntervalsFromStartTime,
        TimeIntervalSize = 6.0,
        TimeIntervalUnits = esriTimeUnits.esriTimeUnitsMonths,
        // NOTE: When setting custom time binning, be sure to set CalculateAutomaticTimeInterval = false
        CalculateAutomaticTimeInterval = false,
        // Define custom line color
        ColorType = ChartColorType.CustomColor,
        LineSymbolProperties = new CIMChartLineSymbolProperties {
            Style = ChartLineDashStyle.DashDot,
            Color = new CIMRGBColor { R = 0, G = 150, B = 20 },
        },
        MarkerSymbolProperties = new CIMChartMarkerSymbolProperties
        {
            Color = new CIMRGBColor { R = 0, G = 150, B = 20 }
        }
    },
    }
};

// Add new chart to layer's existing list of charts (if any exist)
var newChartsLine = new CIMChart[] { lineChart };
var allChartsLine = (lyrDefLine == null) ? newChartsLine : lyrDefLine.Charts.Concat(newChartsLine);
// Add CIM chart to layer defintion
lyrDefLine.Charts = allChartsLine.ToArray();
lyrLine.SetDefinition(lyrDefLine);
Create a histogram for every field of type Double
// For more information on the chart CIM specification:
// https://github.com/Esri/cim-spec/blob/main/docs/v3/CIMCharts.md

var lyrsHistogram = MapView.Active.Map.GetLayersAsFlattenedList().OfType<FeatureLayer>();
var lyrHistogram = lyrsHistogram.First();
var lyrDefHistogram = lyrHistogram.GetDefinition();

// Get list names for fields of type Double
var doubleFields = lyrHistogram.GetFieldDescriptions().Where(f => f.Type == FieldType.Double).Select(f => f.Name);

// Create list that will contain all histograms
var histograms = new List<CIMChart>();

// Create histogram for each Double field
foreach (var field in doubleFields)
{
    // Define histogram CIM properties
    var histogram = new CIMChart
    {
        Name = $"histogram_{field}",
        GeneralProperties = new CIMChartGeneralProperties
        {
            Title = $"Histogram for {field}",
            UseAutomaticTitle = false
        },
        Series = new CIMChartSeries[]
        {
        new CIMChartHistogramSeries {
            UniqueName = "histogramSeries",
            Name = $"histogram_{field}",
            BinCount = 15,
            // Specify the number field
            Fields = new string[] { field },
        }
        }
    };


    histograms.Add(histogram);
};

// Add new chart to layer's existing list of charts (if any exist)
var allChartsHistogram = (lyrDefHistogram == null) ? histograms : lyrDefHistogram.Charts.Concat(histograms);
// Add CIM chart to layer defintion
lyrDefHistogram.Charts = allChartsHistogram.ToArray();
lyrHistogram.SetDefinition(lyrDefHistogram);
Create a multiseries bar chart
// For more information on the chart CIM specification:
// https://github.com/Esri/cim-spec/blob/main/docs/v3/CIMCharts.md

// Define fields names used in chart parameters.
const string categoryField = "neighbourhood_group";
const string splitByField = "room_type";

var lyrsBar = MapView.Active.Map.GetLayersAsFlattenedList().OfType<FeatureLayer>();
var lyrBar = lyrsBar.First();
var lyrDefBar = lyrBar.GetDefinition();

// Get unique values for `splitByField`
var values = new List<string>();
using (RowCursor cursor = lyrBar.Search())
{
    while (cursor.MoveNext())
    {
        var value = Convert.ToString(cursor.Current[splitByField]);
        values.Add(value);
    }
};
var uniqueValues = values.Distinct().ToList();

// Define bar chart CIM properties
var barChart = new CIMChart
{
    Name = "barChart",
    GeneralProperties = new CIMChartGeneralProperties
    {
        Title = $"{categoryField} grouped by {splitByField}",
        UseAutomaticTitle = false
    },
};


// Create list to store the info for each chart series
var allSeries = new List<CIMChartSeries>();

// Create a series for each unique category
foreach (var value in uniqueValues)
{
    var series = new CIMChartBarSeries
    {
        UniqueName = value,
        Name = value,
        // Specify the category field
        Fields = new string[] { categoryField, string.Empty },
        // Specify the WhereClause to filter a series by unique value
        WhereClause = $"{splitByField} = '{value}'",
        GroupFields = new[] { categoryField },
        // Specify aggregation type
        FieldAggregation = new string[] { string.Empty, "COUNT" }
    };

    allSeries.Add(series);

}

barChart.Series = allSeries.ToArray();

// Add new chart to layer's existing list of charts (if any exist)
var newChartsBar = new CIMChart[] { barChart };
var allChartsBar = (lyrDefBar == null) ? newChartsBar : lyrDefBar.Charts.Concat(newChartsBar);
// Add CIM chart to layer defintion
lyrDefBar.Charts = allChartsBar.ToArray();
lyrBar.SetDefinition(lyrDefBar);
Create a pie chart with custom legend formatting
// For more information on the chart CIM specification:
// https://github.com/Esri/cim-spec/blob/main/docs/v3/CIMCharts.md

// Define fields names used in chart parameters.
const string fieldCategory = "neighbourhood_group";

var lyrs = MapView.Active.Map.GetLayersAsFlattenedList().OfType<FeatureLayer>();
var lyr = lyrs.First();
var lyrDef = lyr.GetDefinition();

// Define pie chart CIM properties
var pieChart = new CIMChart
{
   Name = "pieChart",
   GeneralProperties = new CIMChartGeneralProperties
   {
      Title = "Pie chart with custom legend formatting",
      UseAutomaticTitle = true
   },
   Legend = new CIMChartLegend
   {
      LegendText = new CIMChartTextProperties
      {
         FontFillColor = new CIMRGBColor { R = 0, G = 250, B = 20 }, // Specify new font color
         FontSize = 6.0, // Specify new font size
      }
   },
   Series = new CIMChartSeries[] {
      new CIMChartPieSeries
      {
         UniqueName = "pieSeries",
         Name = "pieSeries",
         Fields = new string[] { fieldCategory, string.Empty }
      }
   }
};

// Add new chart to layer's existing list of charts (if any exist)
var newCharts = new CIMChart[] { pieChart };
var allCharts = (lyrDef?.Charts == null) ? newCharts : lyrDef.Charts.Concat(newCharts);
// Add CIM chart to layer defintion
lyrDef.Charts = allCharts.ToArray();
lyr.SetDefinition(lyrDef);
Inheritance Hierarchy
System.Object
ArcGIS.Core.CIM.CIMObject
ArcGIS.Core.CIM.CIMChartGeneralProperties
Requirements
Target Platforms: Windows 11, Windows 10
ArcGIS Pro version: 3 or higher.
See Also