Available with Spatial Analyst license.
The Feature Solar Radiation tool calculates the incoming solar radiation (insolation) for input points or polygon features relative to the surface (ground). The input features can represent a location, an area, or an object or surface that has attributes such as size, height, and orientation. The amount of solar radiation energy received is calculated for each feature. The output radiation values calculated are the total and average per unit area of the feature, with units kilowatt hours (kWh) and kilowatt hours per square meter (kWh/m2), respectively.
The amount of solar radiation is calculated for each feature from the area or cells that intersect the input surface raster. Since points do not have an area value, the average amount (per unit area) of total, diffuse, direct radiation is calculated. This is similar to the raster analysis output for only one cell. For polygon features, or if an area is specified for the point, the total insolation is returned for the whole area of the feature will be calculated multiplying by the total area of the feature (units kWh). The area of the feature is determined from the geometry attributes or calculated if necessary.
Feature parameters
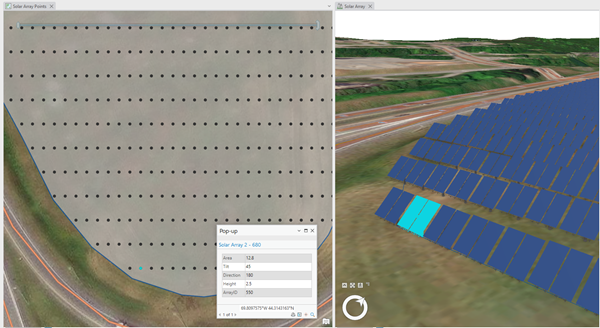
Using feature parameters or attributes allows you to model your input features as a structure, such as a building or a solar panel oriented on the surface. The size (area) and orientation, incline, direction, and surface offset can be specified as attributes, which you can apply for all features or for each input feature individually. If these values are not specified directly, they will be calculated from the input feature or surface where required.
The following examples demonstrate when to specify feature parameters:
- To calculate the energy potential of a solar panel oriented on a rooftop or a solar farm array
- To calculate the incoming radiation on the vertical side of the building to understand energy efficiencies or solar design
- To model a solar panel mounted on a remote vehicle, as it rotates or moves along the surface, through providing multiple features and running the analysis over time

Calculate solar radiation for time intervals
By default, the tool will calculate a single total insolation value for the entire time range. Check the Calculate insolation for time intervals parameter to calculate multiple radiation values for the specified interval based on the Time Interval Unit and Time Interval parameter values. The total radiation will be calculated for every interval—no interval will be excluded or will return partial values. If there is no solar radiation for a time interval a value of zero will be returned.
Intervals are calculated from specified start to end times. If the total time specified between the start and end times is not equally divisible by the time interval, the total duration will be extended internally to provide the required number of time slices. For example, if the time configuration was specified for a total of 14 days, with an interval of 3 days, the number of intervals will be increased to provide a result for the time and days 13 through 15. The first record will always be the start time plus the interval (time0 + timeinterval)). The intervals are based on the specified start time. For example, where the start day time is 1/19/2023 05:00 PM UTC with 1 day interval, the interval will be computed for 24 hours from 5:00 PM until 5:00 PM the next day and continue until the specified end time.
Explore time interval solar results
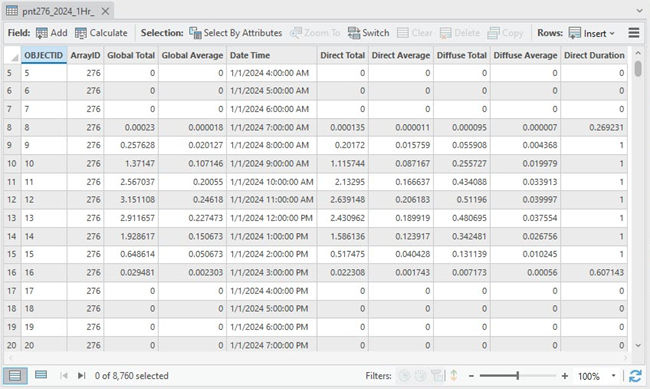
The result for time interval analysis is a time series feature table containing one-to-many records for each input feature and time interval. Analyze and explore the results with statistical analysis or visualize the data using charts to gain additional insights.
An example of the output attribute table for a solar power array is shown below.

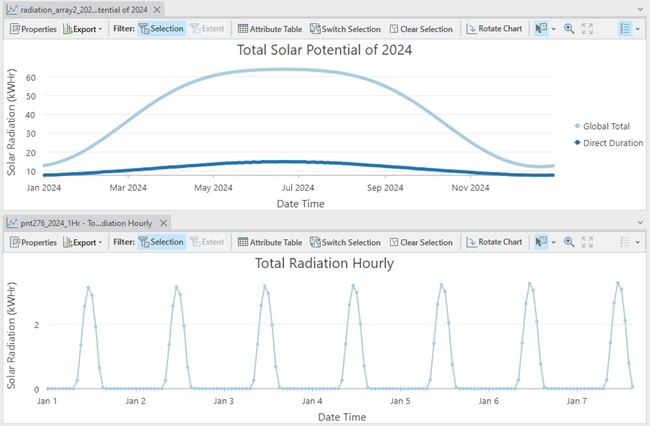
Some examples of the graphs for solar potential energy, duration, and hourly peak amount are shown below.
