You have several options available to you in terms of how you display or symbolize a LAS dataset. You can quickly change the display of a LAS dataset layer with the Symbology drop-down menu or the Symbology pane. The display renderers on the Symbology drop-down menu only show one renderer at a time. To display more than one renderer for a LAS dataset, consider using the Symbology pane.
The Symbology options for a LAS dataset layer honor any applied LAS dataset filters. See Change filters for a LAS dataset for more information on LAS dataset filter options.
Symbology for a single LAS or ZLAS file is supported in the same way as a LAS dataset.
When a LAS dataset, LAS, or ZLAS file is added to a 3D scene in ArcGIS Pro, the points are drawn with an elevation renderer and eye-dome lighting applied, by default. Eye-dome lighting is a shading technique that improves the perception of depth and contour when viewing LAS datasets. To turn eye-dome lighting on or off, select a LAS dataset in the Contents pane, select the LAS Dataset Layer tab set, and locate the Lighting and Shading group. Select the Eye-Dome Lighting button to turn the shading effect on or off.
When a LAS dataset, LAS, or ZLAS file is added to a 2D map in ArcGIS Pro, the points are drawn with an elevation renderer only.
Any referenced surface constraints, which are usually derived from some sort of remote sensing technique like photogrammetry. Surface constraints are enforced when the LAS dataset is drawn as a TIN surface model.
Missing LAS files
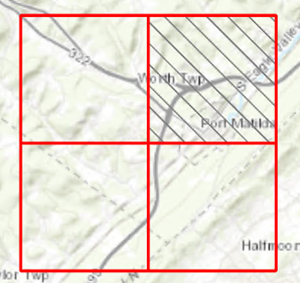
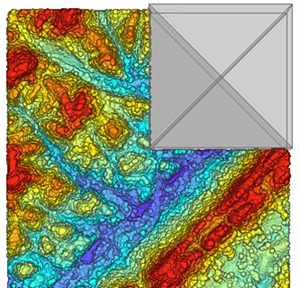
If any files are missing from a LAS dataset, they will be symbolized with a gray pattern. The images below depict missing LAS files symbology.


Use the symbology drop-down menu
Use the Symbology drop-down menu to quickly change the symbology of a LAS dataset between common point and surface symbology renderers. The appearance of the LAS dataset automatically changes with each selection from the Symbology drop-down menu.
Follow these steps to access the Symbology drop-down menu:
- Select a LAS dataset layer in the Contents pane and click the LAS Dataset Layer tab set.
- On the LAS Dataset Layer tab set, in the Drawing group, click the Symbology drop-down arrow
 .
. - Select the applicable symbology for the selected LAS dataset layer.
There are several common triangulated irregular network (TIN)-based symbology renderers you can use to display your LAS dataset. Once a selection is made, the changes apply to the LAS dataset listed in the active LAS dataset Layer drop-down menu.
Select from any of the following point-based symbology renderers:
| Point symbology | Description |
|---|---|
Elevation | Symbolize LAS points based on elevation. |
Class | Symbolize the LAS dataset points by the LAS classification code. |
Return | Symbolize the LAS dataset points by the lidar pulse return number. |
RGB | Symbolize the LAS dataset points by RGB values assigned to each point. |
Intensity | Symbolize the LAS dataset points by intensity values assigned to each point. |
Select from any of the following surface-based symbology renderers:
| TIN surface symbology | Description |
|---|---|
Elevation | Symbolize TIN using elevation. |
Aspect | Symbolize TIN using aspect values. |
Slope | Symbolize TIN using slope values. |
Select from the following line-based symbology renderers:
| Line symbology | Description |
|---|---|
Contour | Symbolize TIN using contours. |
Edges | Symbolize TIN using edges. |
Use the symbology pane
The Symbology pane for LAS dataset layers allows you to draw a LAS dataset as points, contours, edges, or a surface, as well as any combination of these symbology renderers. Only the types of symbology that are valid for the LAS dataset you have selected will be presented to you.
- Select a LAS dataset layer in the Contents pane and click the LAS Dataset Layer tab set.
- On the LAS Dataset Layer tab set, in the Drawing group, click the Symbology button.
This opens the Symbology pane. From here, modify the applicable symbology for the LAS dataset selected in the Contents pane.
You can also select other LAS dataset layers from the Contents pane, and without closing the Symbology pane, you can apply the same symbology to them.
For more information on symbology in ArcGIS Pro, see Symbolization, Data classification methods, and Symbolize feature layers.
Symbolize using points
Clicking the Symbolize your layer using points button opens the Points pane. The following options will become available once the Draw using check box is selected. The table provides the available point symbology attributes from the Draw using drop-down menu. Once the point-based attribute is selected from the Draw using drop-down menu, the symbology options provided in the Symbology pane will show either stretch, classify, or unique value symbology options.
| Point symbology attributes | Description |
|---|---|
Elevation (classified) | Symbolize points based on point elevation using classified options. |
Elevation | Symbolize points based on point elevation using stretch options. |
RGB | Symbolize the LAS dataset points by RGB values assigned to each point if available. |
Intensity | Symbolize the points by intensity values assigned to each point if available. |
Scan angle | Symbolize the points based on the scan angle. |
Classification | Symbolize the points by the LAS classification code if available. |
Return number | Symbolize the points based on the return number. |
Number of return | Symbolize the points by the lidar pulse return number if available. |
User data | Symbolize the points with user data. |
Point source ID | Symbolize the points by the point source ID. |
Classify
Classify allows you to group points together in a specified number of classes when displaying Elevation.
- Symbol scale increases or decreases the size of the points based on minimum and maximum values.
- Modulate using intensity darkens the base color computed by the renderer based on the intensity value for each point. High intensity values leave the base color unchanged, while low intensity may darken the base color. The amount of modulation is proportional to the intensity value within an intensity range representative of the dataset where extreme intensity values (low/high) have been excluded.
- Method shows the available options used to classify the points. For more information on the standard classification methods provided in ArcGIS Pro, see Data classification methods.
- Classes allows you to change the number of classes used.
- Color scheme allows you to choose a color scheme to apply.
- Class breaks defines the range of values to display.
Stretch
Stretch allows you to define how the values will be stretched between minimum and maximum values that are associated by a color ramp for Elevation, RGB, Intensity, and Scan angle values.
- Symbol Size increases or decreases the size of the points based on minimum and maximum values.
- Draw allows you to switch between Elevation and Intensity values.
- Modulate using intensity darkens the base color computed by the renderer based on the intensity value for each point. High intensity values leave the base color unchanged, while low intensity may darken the base color. The amount of modulation is proportional to the intensity value within an intensity range representative of the dataset where extreme intensity values (low/high) have been excluded.
- Color scheme sets the color scheme.
- Stretch defines the range of values to display.
Note:
You can only change the size of the RGB rendered points.
Unique value
Unique Values assigns a color to each value in your dataset. LAS files of a LAS dataset layer might be attributed with additional information. A unique values renderer allows the points to be rendered with individual colors for the following point attributes: Classification, Return number, Number of returns, User data, and Point source ID.
- Symbol scale increases or decreases the size of the points based on minimum and maximum values.
- Modulate using intensity darkens the base color computed by the renderer based on the intensity value for each point. High intensity values leave the base color unchanged, while low intensity may darken the base color. The amount of modulation is proportional to the intensity value within an intensity range representative of the dataset where extreme intensity values (low/high) have been excluded.
- Color scheme allows modification to the current color scheme.
- Values defines the range of values to display.
Symbolize using contours
Click the Symbolize your layer using contours button  to open the Contours pane. The following options will become available once the Draw contours check box is selected:
- Contour interval is the interval between the contours lines.
- Reference height defines the starting z-value from which the contour interval is either added or subtracted to delineate contours. The default value is 0.0.
- Index factor is commonly used as a cartographic aid for assisting in the visualization of contour lines. The index factor is typically five times larger than the contour interval.
- Contour types shows the Symbol, Type, and Label for the contours.
Symbolize using edges
A TIN is used to display a LAS dataset as a surface. Edges are line features using the triangle edges of a TIN dataset.
Click the Symbolize your layer using edges button  to open the Edges pane. Once the Draw using check box is selected, use the drop-down menu to select either Simple or Edge Type to symbolize the edge lines of the TIN.
Symbolize using a surface
A TIN is used to display a LAS dataset as a surface. A LAS dataset rendered as a TIN can be symbolized using Simple, Elevation, Slope, or Aspect symbology.
Click the Symbolize your layer using a surface button  to open the Surface pane. The following options will become available once the Draw using check box is selected.
Select from any of the following surface-based symbology renderers:
| TIN surface symbology | Description |
|---|---|
Simple | Symbolize a TIN using a single symbol. |
Elevation | Symbolize a TIN using elevation. |
Aspect | Symbolize a TIN using aspect values. |
| Slope | Symbolize a TIN using slope values. |
Reset Legend Elevation Range
You can reset the elevation symbology range classes for a LAS dataset layer based on the current display extent. You can redefine the class breaks using this option so that you get the full range of colors for that area of interest.
The Reset Legend Elevation Range option for a LAS dataset layers is located on the context menu of the layer.
- Select a LAS dataset layer in the Contents pane and right-click to access the context menu.
- Select the Reset Legend Elevation Range option.
The elevation is reset based on the current display extent.


