Diagnostic Monitor is an integrated diagnostic facility in ArcGIS Pro. Status information, logs, and events are presented and continuously updated in Diagnostic Monitor while ArcGIS Pro is running. Diagnostic Monitor contains a set of tabs and status indicators. Diagnostic Monitor currently includes the Counters, Tasks, HTTP, Log, Diagnostic Properties, and States tabs.
The information on the Diagnostic Monitor window can be used to help diagnose various application problems including unresponsive conditions, resource overconsumption, function failures, and performance degradation.

Note:
Diagnostic Monitor is available in all ArcGIS Pro-based products and is different from ArcGIS Monitor, a product for ArcGIS Enterprise deployments.
Start Diagnostic Monitor
Opening the Diagnostic Monitor window enables Diagnostic mode.
You can open the Diagnostic Monitor window in the following ways:
- In an open project, click the Help tab on the ribbon. In the Performance group, click Diagnostic Monitor
 .
. - Press Ctrl+Alt+M while ArcGIS Pro is open. A project doesn't need to be open.
- Start ArcGIS Pro from the command line using the switch /enablediagnostics.
If you use the command line option, you can also include a /loglevel=debug parameter to enable debug mode in Diagnostic Monitor. Debug mode persists through your subsequent ArcGIS Pro sessions until you disable it from the Log tab.
Note:
When Diagnostic Monitor is enabled from the command line, the dialog box is initially minimized on the Microsoft Windows taskbar.
To troubleshoot a workflow with Diagnostic Monitor, open the monitor before working on the trouble area. To configure the Diagnostic Monitor window to stay on top of all other windows in ArcGIS Pro, right-click the window's caption area and click Always On Top. This can be useful when you want to closely monitor activity in Diagnostic Monitor while using different application features.
Note:
Diagnostic Monitor capabilities rely on recording and logging the application states and events of ArcGIS Pro. Although Diagnostic Monitor was engineered to be as lightweight as possible, there may be minor performance impacts on ArcGIS Pro workflows while the Diagnostic Monitor window is open and logging information.
ArcGIS Pro architectural overview
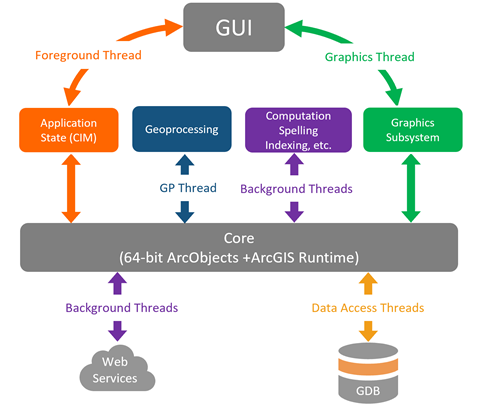
ArcGIS Pro is a 64-bit, multithreaded, modular application. Functional subsystems are loaded on demand and perform work—such as computing a buffer or rendering a map—within worker threads or within separate worker processes. In most cases, logical units of work (operations) are organized into one or more tasks while running. Tasks are central to how work is performed in ArcGIS Pro, and they are prominently featured in Diagnostic Monitor.
A dedicated thread is responsible for rendering the application's user interface elements, and for processing user input in the form of keyboard input and mouse clicks. While an operation is running on one of the worker threads, the graphical user interface (GUI) thread provides feedback relevant to how the operation is progressing, as well as a means for canceling the operation if applicable. Diagnostic Monitor runs on a thread that's independent of the GUI. This allows the Diagnostic Monitor window to remain responsive even if the GUI thread is unresponsive.
Worker threads in ArcGIS Pro are divided into families dedicated to specific functional areas.
- Foreground Threads—A set of four worker threads that governs the Cartographic Information Model (CIM), the primary repository of the configuration state in the currently loaded project. These threads also help accelerate map rendering. Some types of user interactions are prohibited while operations are running on foreground threads.
- High Priority Background Threads and Low Priority Background Threads—These threads perform a wide range of operations that do not depend on the CIM state and can run in the background while the user performs other actions. Tasks assigned to high-priority background threads run faster and have priority over tasks assigned to low-priority background threads.
- Miscellaneous Threads—The Background Geoprocessing thread is used to perform background geoprocessing operations. Internally, this thread often collaborates with other threads to complete the operation. The Shared Background thread is used for special cases in which sets of tasks must run on the same consistent thread over time.
Status area
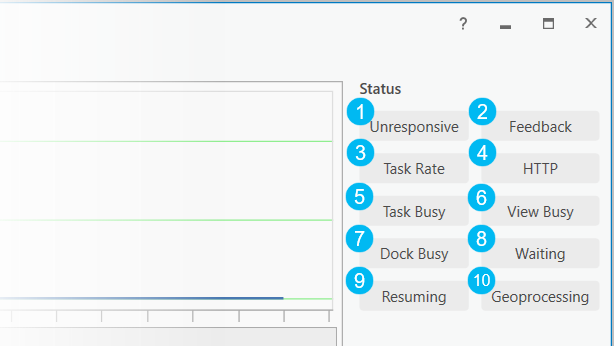
The Status area contains Status indicators and Thread Activity indicators. Status indicators display different colors depending on the current application status. They are helpful in narrowing down problems occurring in the application. Thread Activity indicators display colors based on the status of the corresponding threads.
Status indicators
| Element | Description |
|---|---|
 | Red indicates that the GUI thread is no longer sending messages and cannot react to mouse or keyboard input; UI graphics may render incorrectly when the GUI thread is not responding. Occurrences of unresponsiveness are recorded in the Unresponsive Log. |
 | Yellow indicates when the active task does not have an associated progressor, and thus, inadequate feedback is being presented to the user while the task is running. Associated tasks are also flagged in yellow in the task log when this condition is detected. |
 | Yellow indicates that the issuance rate for tasks has exceeded 10 per second. |
 | Green indicates that one or more HTTP requests are currently active in the application. |
 | Green indicates that a task is currently running on the foreground thread. Various buttons and tools may be unavailable while any foreground task is running. |
 | Yellow indicates that a view—usually containing a map, globe, scene or layout—is currently busy. Various buttons and tools may be unavailable while a view is busy. |
 | Yellow indicates that a pane is currently busy. Various buttons and tools may be unavailable while a pane is busy. |
 | Yellow indicates that a task is stalled due to drawing-related operations currently running on one of the foreground threads. Various buttons and tools may be unavailable while the application is waiting. |
 | Yellow indicates that a task is stalled while a previously suspended drawing operation is being resumed. Various buttons and tools may be unavailable while the application is resuming. |
 | Green indicates that a geoprocessing operation is currently running. This indicator will be lit regardless of whether it's a background or foreground geoprocessing operation. |
Thread activity indicators
Each of the threads mentioned previously has a corresponding activity indicator within the status area of Diagnostic Monitor. Thread status indicators are green if the associated thread is currently running and gray if the thread is inactive (sleeping). Thread status indicators may appear dark gray if the host machine's CPU lacks sufficient cores to support additional threads.
Diagnostic Monitor tabs
Diagnostic Monitor consists of the Counters, Tasks, HTTP, Log, Diagnostic Properties, and States tabs. The Counters tab lists internal counters. The Tasks tab displays recent tasks. The HTTP tab provides an HTTP request and response viewer. The Log tab shows an event log viewer. The Diagnostic Properties tab displays diagnostic information. The States tab allows you to view all enabled application states and active view states associated with the corresponding ArcGIS Pro session.
Counters tab
The Counters tab consists of a list of named internal counters. Each counter is linked to the graph above the list. When a counter in the list is selected, the graph updates to display the historical values for that counter over the last 20 seconds.
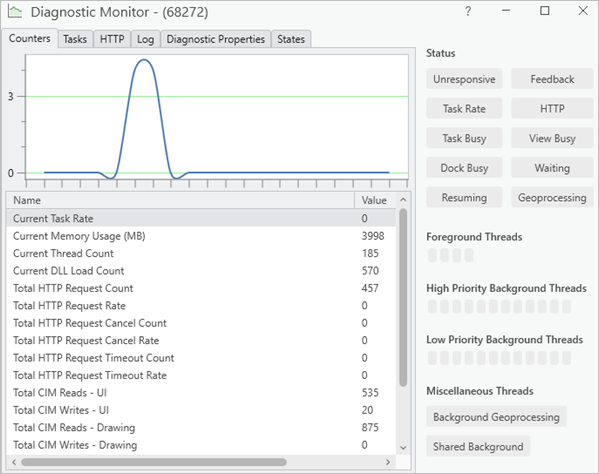
Within the counter list are useful metrics such as memory consumption, thread count, HTTP request count, and loaded DLL count. A few counters require additional explanation:
- Current Task Rate—The current rate at which tasks are being queued to the foreground threads. A high count can indicate that an unnecessarily high number of tasks is being issued to perform the operation. Operations with a high number of tasks can be less efficient.
- CIM Counters—These counters are used to record the total count of read and write operations on the CIM. Drawing-related reads and writes are counted separately. Since each operation has associated overhead, smaller jumps are preferable to larger jumps within a time span.
- Total HTTP Request Timeout Counters—These counters are used to record the number and rate of total HTTP requests that have timed out. Requests that increment these counters are most commonly associated with HTTP response codes 408 and 504.
- IRequest Counters—These counters are reserved for internal use.
Tasks tab
The Tasks tab contains a log for tasks that were recently issued from user interaction and another log for any unresponsive conditions that have occurred on the GUI thread.
Recent UI Task log
The Recent UI Task log provides a record of the most recent tasks issued in response to user interactions. Due to the overhead associated with identifying task functions, this log is unavailable whenever the Diagnostic Monitor window is closed. By default, tasks are sorted in chronological order, with the most recently run task at the top of the list. Inner tasks (queued from within a running outer task) do not appear in this list. Tasks that are queued or currently running are displayed in green. Each task has an associated set of properties:
- Task #—A number indicating the sequential position of a task; for example, Task # 42 indicates the forty-second task within the running process.
- Queued Time—The wall-clock time when the task was first queued. Tasks initiated while another task is still running are queued and will not begin to run until the current task is complete. Buttons and controls are normally disabled while a foreground task is running to prevent additional tasks from being queued while the state of the application is transitioning.
- Task time—The amount of time, in milliseconds, associated with the running of the task.
- Resume Time—The time spent waiting, in milliseconds, for a drawing resumption to complete.
- Wait Time—The time spent waiting, in milliseconds, for drawing-related operations to complete.
- Total Time—The total time needed, in milliseconds, to run the task, from the time the task was queued to the time the task completes (including any time associated with drawing resumption).
- Function—The name of the outermost function best associated with the task.
Tasks that are queued, or still running, display -1 for their time values. The actual time will be displayed in milliseconds when the task completes or is canceled.
A heuristic is used to display the function that is most relevant to the task being queued. The heuristic goes through the call stack looking for a frame containing non-OS functions.
The Recent UI Task log can be sorted by any column, in ascending or descending order. This capability can be used to identify, for instance, the task with the longest run time. The content of the log can be copied to the clipboard or cleared by right-clicking anywhere on the list and clicking Copy or Clear, respectively.
Unresponsive log
Whenever the GUI thread becomes unresponsive, an unresponsive condition event is logged containing the start time and total duration. The content of this log can be copied to the clipboard by right-clicking anywhere on the list and clicking Copy.
HTTP tab
The HTTP tab is divided into two sections: a requests menu and a details section.
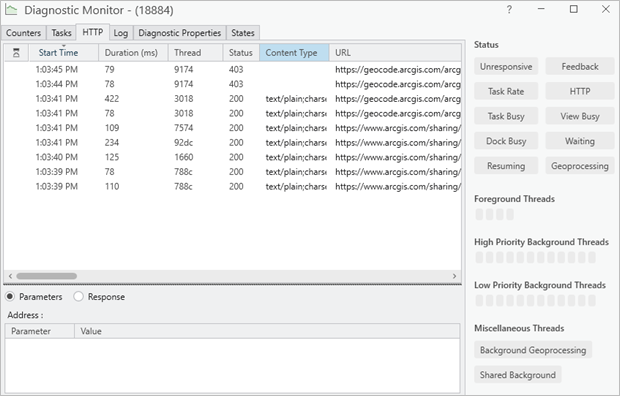
The requests section is a list of captured HTTP requests. While the Diagnostic Monitor window is open, HTTP requests sent by ArcGIS Pro are recorded in this list, starting with the most recent request. Additionally, requests that are still awaiting a response are added to the top of the list before being sorted in the order mentioned above. These requests awaiting a response are denoted with a down arrow icon.
The Duration column shows how long a completed request took to receive a response from the server. The Status column contains the response code received by the associated request. The Content Type column contains the data format of the response when applicable. The URL column is the complete URL of the request.
When you select a request in the requests section, the details section populates with the relevant information about the request as well as any responses received. If the Parameters button is selected, Parameter(s) and Value(s) will be displayed in their respective columns. If the Response button is selected, the Diagnostic Monitor window will display the received response for the selected request.
Note:
Only the first 2,048 characters are displayed for logged responses. Any responses that exceed this limit will have characters truncated before being displayed.
Log tab
The Log tab contains an event log viewer and provides sorting and filtering capabilities. When running in Diagnostic mode, numerous subsystems in ArcGIS Pro write diagnostic information as application events in the event log. Event logging begins when the Diagnostic Monitor window is opened and remains active until ArcGIS Pro is closed.
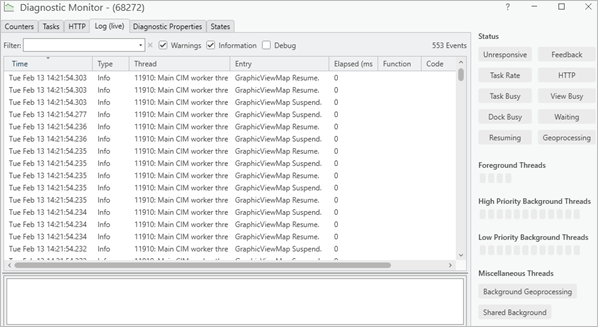
There are four event types:
- Error—Used to indicate significant failures during an operation
- Warning—Less critical and can sometimes be ignored
- Information—Issued to provide additional contextual information about the operation
- Debug—Detailed implementation information, primarily intended for Esri staff
Event types can be filtered in the list using the corresponding check boxes at the top of the list. Because of their importance, error events are always included in the list and cannot be filtered out. The filter entry can be used to be more selective. When text is entered here, only events in which at least one of the columns contains that text (not case sensitive) is displayed.
The total number of matching events is displayed in the upper right of the Log tab. Event logging starts as a live process. As new events are recorded, they are inserted immediately into the Log tab. When the total number of events in the log reaches 100,000 or greater, live logging is disabled for the remained of the session. New events are still recorded, but they do not appear immediately on the Log tab. A Refresh button appears to the left of the total event count. Clicking the Refresh button updates the contents of the Log tab. Events that were recorded in the background are added when the tab is refreshed.
Log files
Log files are saved under the user's Documents folder in the ArcGIS\Diagnostics subfolder by default. In the case of ArcGIS Pro, log files look like this: ArcGISProLog-16360~89343E4F-74E8-4F26-A705-B805E8C92BB0, and have the following properties:
- ArcGISProLog is the host executable name.
- 16360 is the process ID.
- 89343E4F-74E8-4F26-A705-B805E8C92BB0 is the unique ID created for that instance.
An alternative output directory can be specified in instances where you want to save log files to a directory other than the Documents folder. Using the Windows Registry, create a REG_SZ key named EventLogLocation in either Computer\HKEY_LOCAL_MACHINE\SOFTWARE\ESRI\ArcGISPro\Settings\ or Computer\HKEY_CURRENT_USER\SOFTWARE\ESRI\ArcGISPro\Settings\. Set the value of this key to be the alternative directory the log files will be saved in. The next time you run ArcGIS Pro in Diagnostic mode, log files will be saved to <EventLogLocation>\ArcGIS\Diagnostics.
Note:
Your Windows user profile must have read and write permissions to any directory specified as an EventLogLocation value.
A fall-back mechanism is in place for situations where ArcGIS Pro cannot save log files to directories specified as EventLogLocation values. If ArcGIS Pro cannot write to an EventLogLocation directory set under HKEY_LOCAL_MACHINE, it will instead attempt to write log files to the EventLogLocation value set under HKEY_CURRENT_USER. If neither of these directories are specified or cannot be written to, log files will be saved in the default Documents\ArcGIS\Diagnostics folder.
Note:
If a valid EventLogLocation registry key is present under both HKEY_LOCAL_MACHINE and HKEY_CURRENT_USER, the value under HKEY_LOCAL_MACHINE will take priority.
Diagnostic Properties tab
The Diagnostic Properties tab includes diagnostic information that is inserted into error reports to be reviewed by Esri staff.
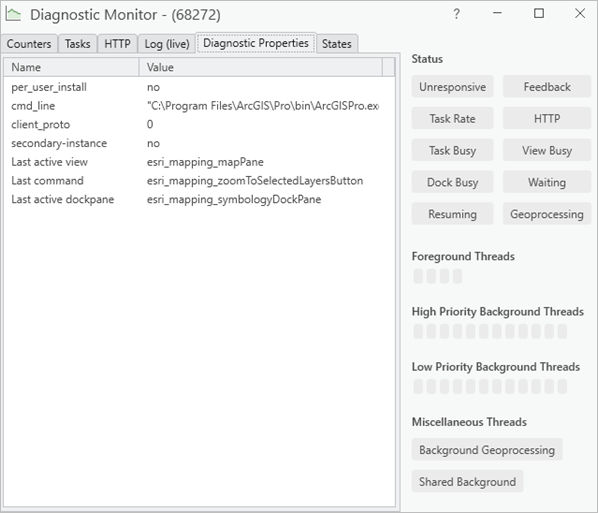
The Name values indicate the following:
- per_user_install—Parameter for whether the ArcGIS Pro installation that Diagnostic Monitor is running off of was installed on a per-user or a per-machine basis.
Value Definition no
The ArcGIS Pro installation was performed for all users on the machine.
yes
The ArcGIS Pro installation was performed for the signed-in user only.
- cmd_line—The command line arguments followed by Windows when ArcGIS Pro was opened.
- client_proto—Shows what type of machine ArcGIS Pro is being used on. The values are as follows:
Value Definition 0
ArcGIS Pro is running natively on the machine.
1
ArcGIS Pro is running on a virtual machine (VM).
2
ArcGIS Pro is running on a machine that is being accessed by Windows Remote Desktop Protocol (RDP).
- secondary-instance—Parameter for whether the ArcGIS Pro application is the only instance of the application currently running.
Value Definition no
There is only one instance of ArcGIS Pro currently running.
yes
There is more than one instance of ArcGIS Pro currently running.
- Last active view—The last view in the application that was active prior to looking at this tab in the Diagnostic Monitor windows. Values can include any valid view such as the Map view or Layout view. In the example above, esri_mapping_mapPane refers to the map view.
- Last command—The last button in the user interface that the user clicked. In the example above, esri_mapping_colorVisionSimulatorButton refers to the Color Vision Deficiency Simulator button.
- Last active dock pane—The last pane in the application that was active prior to looking at this tab in the Diagnostic Monitor window. Values can include any valid pane such as the Contents or Catalog panes. In the example above, esri_core_contentsDockPane refers to the Contents pane.
States tab
The States tab allows you to view all enabled application states and active view states associated with the corresponding ArcGIS Pro session at any given moment, with new additions inserted into their appropriate columns as bolded entries.
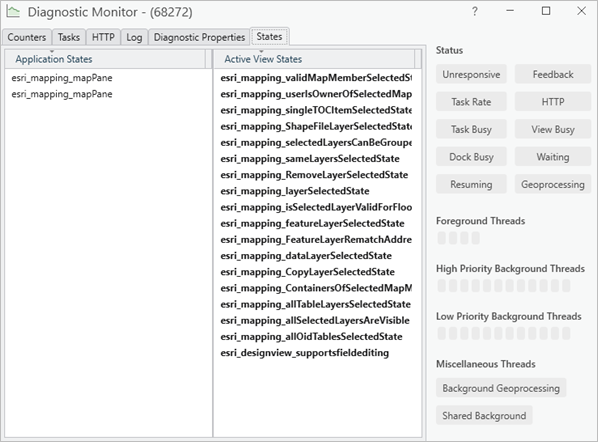
Both application states and active view states belong to a mechanism that the ArcGIS Pro framework uses for expressing when various user interface elements—such as tabs, buttons, and tools—should and shouldn't be visible or enabled in ArcGIS Pro, to present an uncluttered user interface that is curated for the task being performed.
This functionality of Diagnostic Monitor is particularly useful for ArcGIS Pro add-in developers who want to confirm that their defined states are being enabled when they should and shouldn't be.
Learn more about conditions and states.
Drawing performance overlay
You can enable the troubleshooting overlay that gives drawing statistics from the Keyboard Shortcuts dialog box by clicking Global > Drawing Performance Overlay. Pressing the designated shortcut key turns the overlay on and off.
Troubleshooting performance issues
For tips on configuring ArcGIS Pro to improve performance, see Troubleshooting Performance Issues in ArcGIS Pro in Esri Community.