A link chart visually represents part of a knowledge graph. The sections below introduce main link chart terminology and common link chart operations.
Knowledge graph layer and link chart layer
A link chart is composed of point features that represent entities and line features that represent relationships in a knowledge graph. These link charts are created and opened in a link chart view  , and appear in the Maps category
  in the Catalog pane and the catalog view.
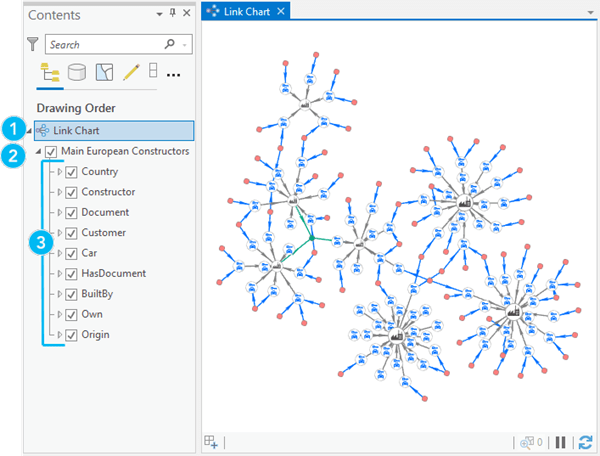
The link chart itself is represented at the top of the Contents pane in the same manner as a map (number 1 in the image below). The knowledge graph is represented as a knowledge graph layer (number 2 in the image below).

The knowledge graph layer is composed of one link chart layer for each entity type and each relationship type in the knowledge graph (number 3 in the image above). Each link chart layer is a composite layer in turn, as described below.
- Link chart layer—This layer represents entities or relationships in the knowledge graph (number 4 in the image below). The default name for this layer corresponds to the name of the entity type or relationship type.
- Link chart aggregation layer—Entities and relationships can be grouped together visually in a link chart. The link chart aggregation layer represents these grouped entities or grouped relationships in the link chart (number 5 in the image below). The aggregation layer allows you to provide different symbology for grouped entities and relationships. The default name for this layer corresponds to the entity or relationship type name with the " - Groups" suffix.

As with feature layers in a map, you can change how link chart layers and link chart aggregation layers are visualized in the link chart using the Appearance, Labeling, and Data tabs on the ribbon and the Layer Properties dialog box.
Note:
After customizing how your link chart layer is visualized, you can use it as a template when you create another link chart.
Grouped entities and grouped relationships
At any time, users can decide to group knowledge graph entities and knowledge graph relationships in their link charts.
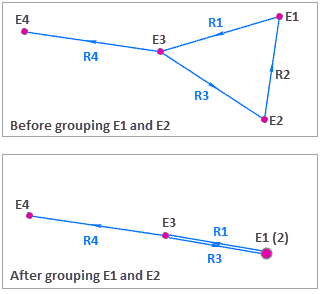
An entity group in a link chart (E1 (2) in the after graphic below) aggregates link chart entities that are based on the same entity type (E1 and E2 in the before graphic below). The entity group also aggregates link chart relationships that connect pairs of the grouped entities (R2 in the before graphic below). 
Learn about grouping entities in a link chart
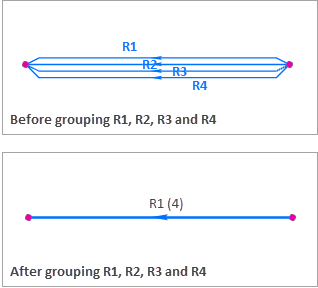
A relationship group only aggregates a set of link chart relationships with the following characteristics:
- All relationships in the set connect the same two entities in the link chart.
- All relationships have the same relationship type.
- All relationships are oriented in the same direction.

Once link chart entities and relationships have been grouped, they are referred to as grouped entities and grouped relationships.
Learn about grouping relationships in a link chart
Learn about managing grouped entities and grouped relationships
Common link chart operations
You can create a link chart from any set of knowledge graph entities and relationships. Once you have a link chart, you can add content to it using the following methods:
- Expand link chart content
- Add entities and relationships to an existing link chart
- Add relationships missing between entities in the link chart
You can also drag entities and relationships from an investigation's contents list or from a set of results in the Search And Filter pane to a link chart.
Explore and analyze the contents of a link chart to gain a deeper understanding of the knowledge graph.