See what's new and improved in ArcGIS Pro 2.3.
Video overview
This video compilation was created by ArcGIS Pro development teams to highlight new functionality specific to this release.
Highlights
The highlights section includes major functionality updates at this release.
Start up experience
The first thing you will notice with ArcGIS Pro 2.3 is the start-up experience. This page has been redesigned and enhanced to include new functionality.
- You can start ArcGIS Pro by double-clicking the following items in Windows Explorer: ArcGIS Pro maps (.mapx), map packages (.mpkx), layouts (.pagx), map layers (.lyrx), and layer packages (.lpkx).
- You can start ArcGIS Pro without first creating a project. A project can be created later if you want to save your work.
- You can pin frequently used projects and project templates to the recent projects and recent project templates lists. The recent projects list can display up to 50 projects.
- You can configure ArcGIS Pro to always open the same project or to automatically start without first creating a project when you start the application.
Reports
Reports are a new project item and are listed in a dedicated folder in the Catalog pane. When you create a report, you can set the data source, organize the data with grouping and sorting,
select a template and styling option, and define the page size and margins.
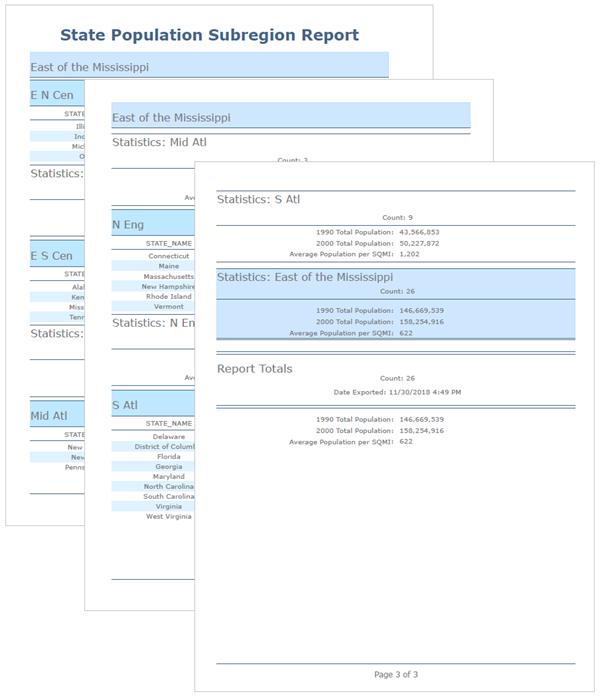
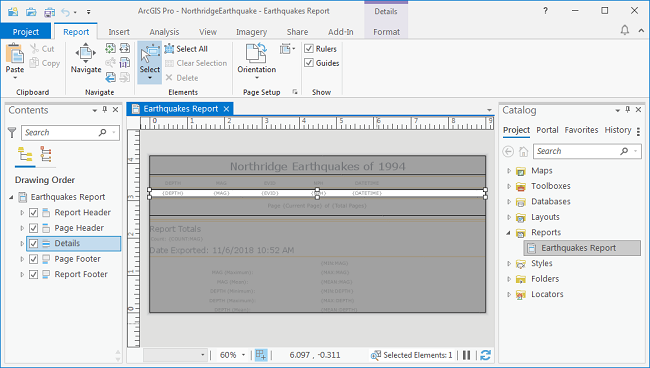
Changes to a report are made in the report view, which divides the report into editable sections such as the report header, group header, and page footer. Static elements such as graphic lines and images and dynamic elements such as summary statistics or date values can both be inserted. Reports can also be shared as PDF files, saved as part of a project package, or saved as a report file (.rptx).
Deep Learning
The Deep Learning toolset is introduced in this release. This new toolbox contains three geoprocessing tools in the ArcGIS Image Analyst toolbox. These tools support image classification and object detection workflows that use deep learning models generated by deep learning frameworks such as TensorFlow, CNTK, and Keras.
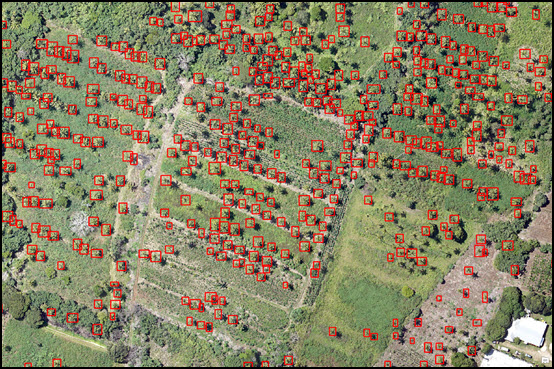
These tools take advantage of the new GPU environment setting to perform analysis in a timely manner. They can also be run in distributed processing environments such as ArcGIS Image Server or raster analysis deployments. They work by using multiple layers in neural networks, where each layer is capable of extracting one or more unique features.
LocateXT
- The ArcGIS LocateXT extension includes a set of tools that allows you to search any text or document for location information and create features from those locations.
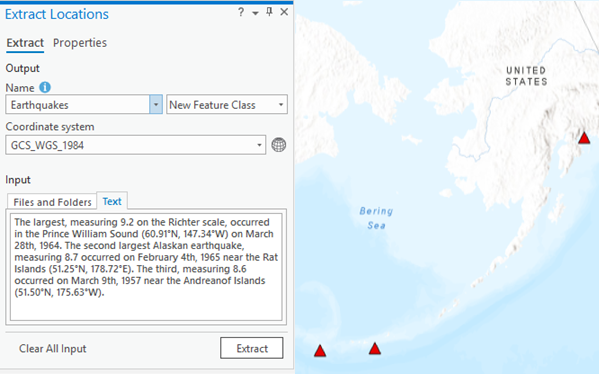
- LocateXT can search PDF documents, Microsoft Office documents, web pages, emails, and social media text. To open the tool, on the Map tab, in the Layer group, click the Add Data drop-down arrow and chose Extract Locations. Two geoprocessing tools (Extract Locations from Document and Extract Locations from Text) have also been added to the To Geodatabase toolset.
Editing tools
Enhance your editing workflows with various new tools. The complete list of new editing tools is farther down the page, but here are four:
- Divide
 hosts tools for dividing polyline and polygon features by a value. Polyline features can be divided by distance, number of parts, or percentage; a polygon feature can be divided into proportional areas, equal areas, or equal widths.
 - Fillet
 creates a circular arc that is tangent between two segments and trims or extends the two connecting segments. You can drag and size the radius dynamically, or type a fixed radial distance.
 - Generalize
 can reduce the complexity of a line or a polygon feature while
retaining its basic shape.
 - Split
 now includes a By Feature tab. This tab allows you to select one or more existing input features and use them to split one or more selected target features.
Attribute rules
- Attribute rules have additional rule types and an improved user experience.
- The Attribute Rules view provides access to view, create, and manage attribute rules on datasets.
- Several new tools have been added to the Attribute Rules toolset. For more information, see the What's new section for the Data management toolbox and history to review new tools and changes to existing tools.
- Batch calculation and validation rules are new rule types that provide the ability to evaluate rules on existing features. These rules are evaluated at a user-specified time using the Error Inspector or the Evaluate Rules tool. For more information, see Evaluate attribute rules.
Note:
The Validation capability used to evaluate batch calculation and validation rules is only available when sharing to ArcGIS Enterprise 10.7 or later. See Considerations when sharing to older portals for more information. - For new Arcade functionality, see the ArcGIS Arcade version 1.5 release notes.
- Contingent attribute values are a new data design feature that allow you to make values in one field dependent on values in another. They use domains and field groups to create a set of fields and a list of valid values for those fields. For example, if a field for power pole materials is set to Wood, the valid values for the height field for that pole are restricted to 35, 40, and 45 feet. If the field is instead set to Steel, the valid values for the height field are 45, 50, and 55 feet. These types of dependencies between your fields can be set up using contingent values.
- The new Transfer Files tool efficiently transfers files between a file system and a cloud storage workspace.
3D Interpolation–Empirical Bayesian Kriging
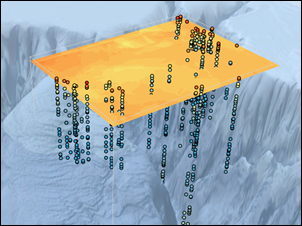
- The Empirical Bayesian Kriging 3D tool allows you to perform interpolation of points and predict the value at all locations between the points in 3D space. It is available as a geoprocessing tool and in the Geostatistical Wizard. For more information, see What is Empirical Bayesian Kriging 3D.
Get started
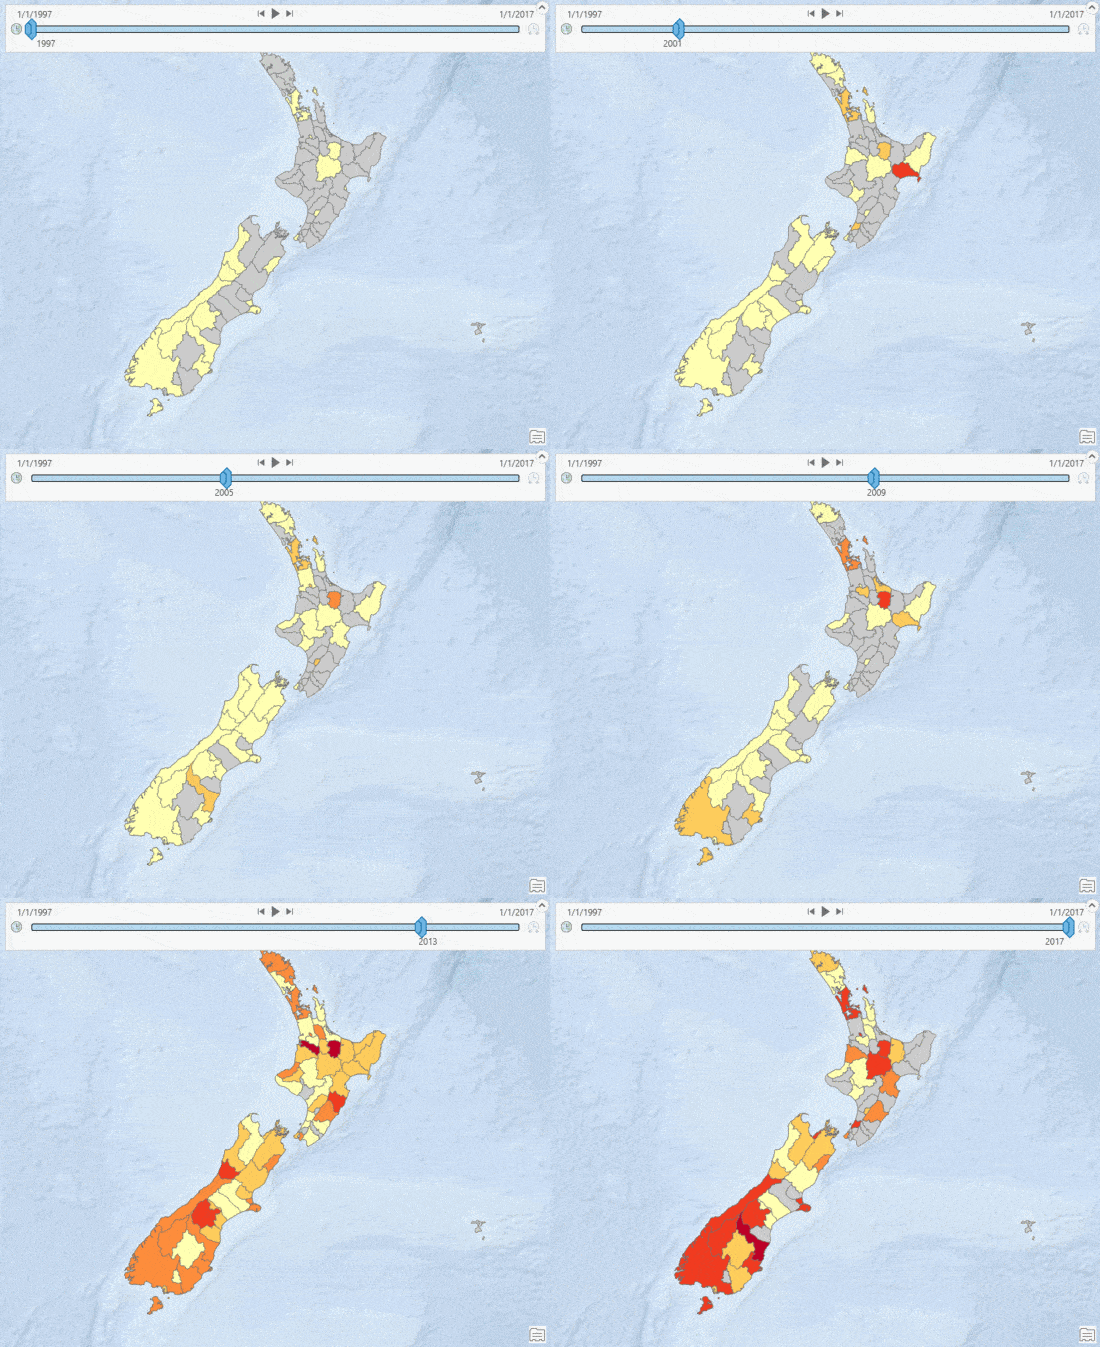
- Three new quick-start tutorials, Author a map, Visualize temporal data, and Manage data, are available.
Accessibility
- Improvements have been made to enhance the accessibility of ArcGIS Pro and its offline help viewer. For more information, see Accessibility in ArcGIS Pro.
Licensing
- You can now add and remove backup license managers when using the Concurrent Use license type. Up to four backup license managers can be added. For more information, see Start ArcGIS Pro with a Concurrent Use license.
Mapping and visualization
General
The following two new map projections are available in ArcGIS Pro 2.3:.
Equal Earth is an equal-area pseudocylindrical projection for world maps that was jointly developed by Tom Patterson (US National Park Service, ret.), Bernhard Jenny (Monash University), and Bojan Šavrič (Esri).
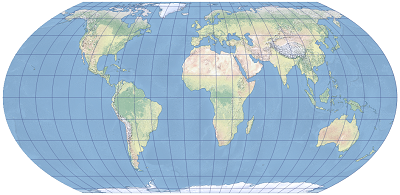
Equal Earth projection The Equal Earth map projection was inspired by the Robinson projection. The difference is that Equal Earth retains the relative size of areas. It was created to provide an alternative to the Gall-Peters projection. Continents in the Equal Earth map projection have a pleasing appearance and are shaped similarly to how they appear on a globe. The projection is appropriate for mapping global phenomena or for any other thematic world map that requires areas at their true relative sizes.
For more information, see the research paper: The Equal Earth map projection.
The Peirce quincuncial map projection depicts the world in a square. It was developed by Charles Sanders Peirce in 1879. In his original design, the projection is centered at the North Pole and displays the equator as a rotated square in the map. The projection is conformal except at the four bends of the equator. The ArcGIS Pro implementation of this projection maintains its conformal property on ellipsoids such as WGS 1984.
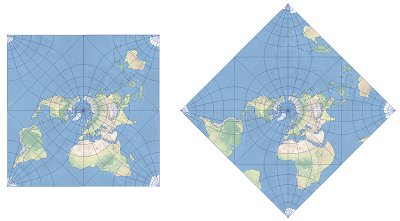
The Peirce projection shown in square and diamond orientation. There are two orientations, square and diamond. Set the Option parameter to 0 for square orientation or 1 for diamond orientation.
Caution:
Layers that rely on server-side projection—such as web feature layers, map image layers, and image service layers—are unable to project to these coordinate systems unless the server version is 10.7 or later.
- You can clip the layers in a map to the custom map extent, a polygon layer, or the selected features of that layer. Optionally, you can specify map layers that do not respect clipping and are drawn at their full extent. Layer clipping affects drawing only. Features hidden from view by clipping still participate in queries and analysis. Specify map clipping on the Clip Layers tab on the Map Properties dialog box.
- Layers and stand-alone tables can now have multiple definition queries associated with them. Switch between queries, or choose to have no active query. Queries are saved with the layer or table. Browse to one or more query expression files to add existing queries to a table or layer. You can apply a definition query to multiple layers simultaneously if the layers share a common query.
- You can change map display units directly from the status bar. The drop-down menu next to the coordinate readout lists all the available unit options. This is a shortcut to accessing the display units for the map from the Map Properties dialog box.
- There are six new map notes templates, three for adding annotation map notes, and one each to add points, lines, or polygons.

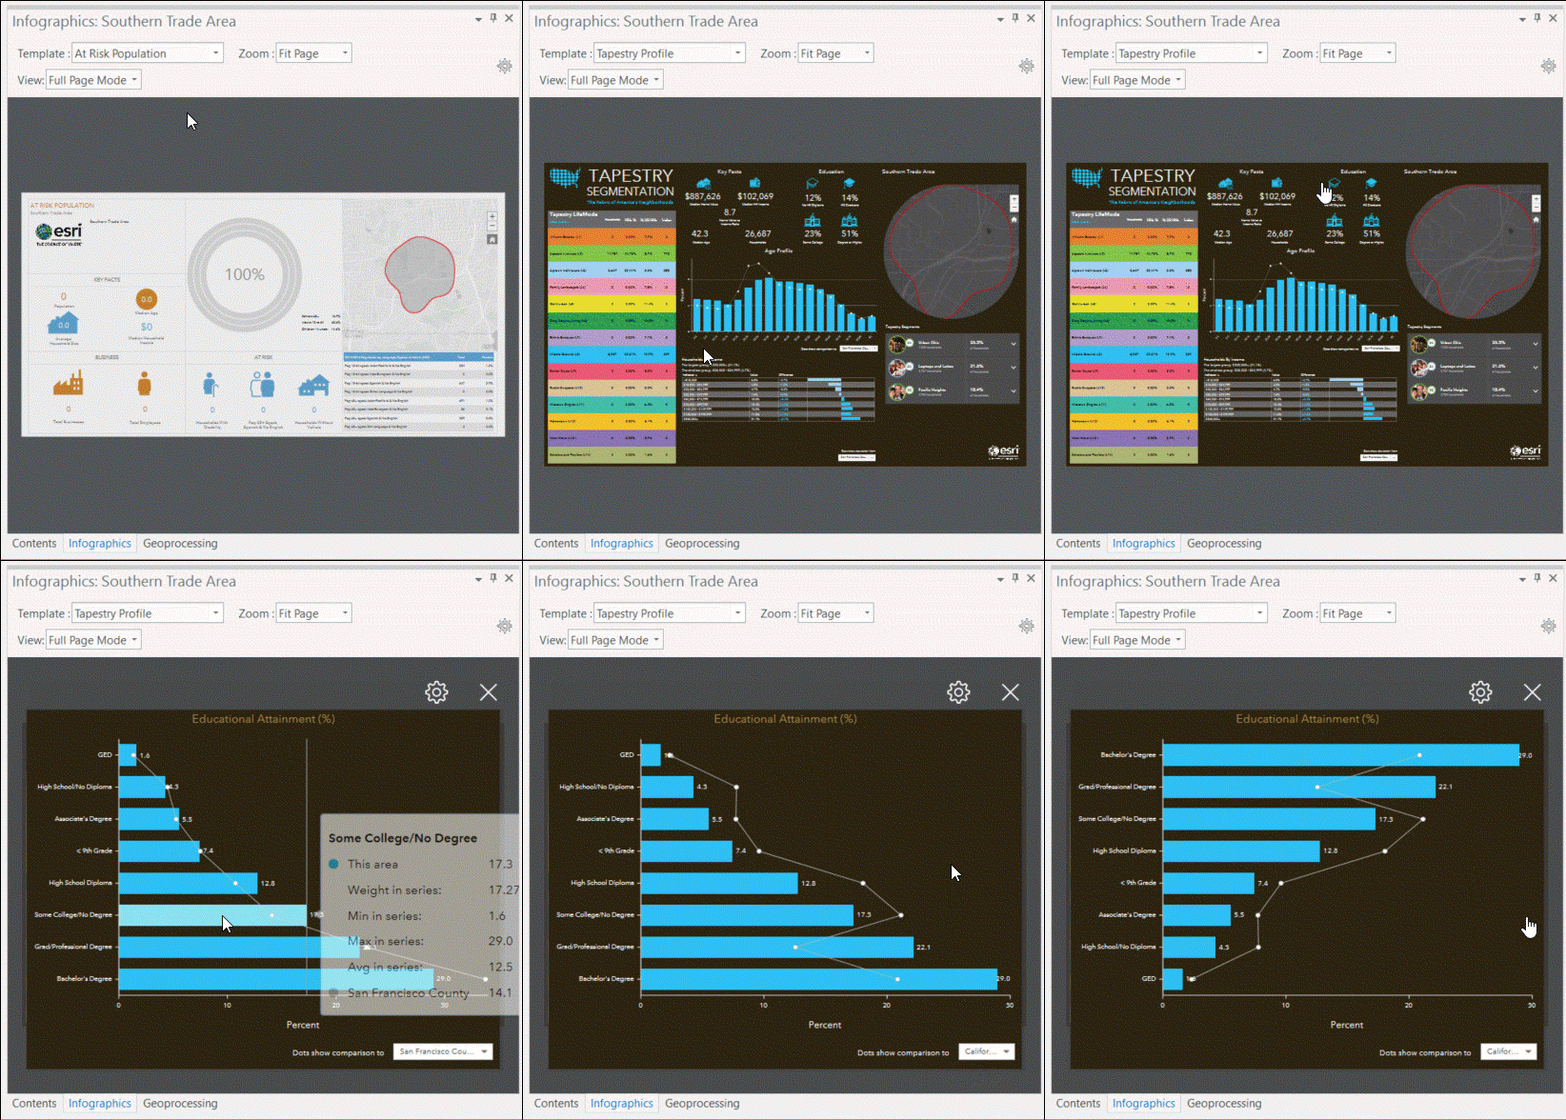
- The Infographics tool now includes several Esri templates accessed from the new Infographics pane. You can view your organization's shared templates or build your own using the My Variables feature.
3D Scenes
- You can now set the view clipping of a scene manually to ensure that very tall or high objects, or those very close to the view camera (such as objects inside a building), are not clipped from view. To learn more, see Adjust view clipping in scenes.
Scene Layers
- New Ground Elevation Surface options are available for setting default elevation sources in new local and global scenes.
- The Create Scene Layer Package tool has been split into the Create 3D Object Scene Layer Package, Create Point Scene Layer Package, and Create Point Cloud Scene Layer Package tools.
- A new texture optimization parameter is available in the Create 3D Object Scene Layer Package tool for optimizing textures according to target platform.
- A new Make Scene Layer tool works with scene service layers with associated feature layers in Python.
- A new Create Mobile Scene Package tool takes scenes and data offline for use in the ArcGIS platform.
- A new Create Building Scene Layer Package tool creates a scene layer package from building (Revit) layers.
- A new building scene layer type allows quick visualization of building scene layers as well as filtering capabilities.
Stream Layers
Stream layers now support retrieving additional geometries and attributes from a related feature service. This means you can work with the following two types of stream services in ArcGIS Pro:
Attribute-only stream services stream changing attribute data from geographically stationary locations. The geometries of the stationary locations are stored in a related feature service. An example is variable temperature data streaming from weather stations. Attribute-only stream services are new in this release of ArcGIS Pro.
Spatial stream services stream features with locations that change, for example, a fleet of delivery trucks moving through a city. Spatial stream layers were available in previous releases of ArcGIS Pro, but now they can have a related feature service that stores additional static attributes. For example, a spatial stream service broadcasts current locations and current loads for delivery trucks, but a related feature service contains static attributes such as the vehicle model and the maximum load capacity of each truck.
- Stream layers are no longer limited to point features only. Stream layers now support polygon and polyline features as well.
- For point stream layers that are track-aware, you can now draw track lines to connect previous observations to show a path that a moving feature traveled.
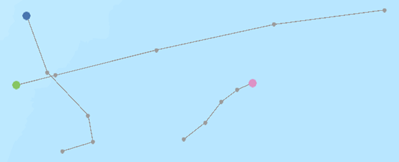
Three moving objects are tracked in a stream layer. Previous observations are connected to clarify movement. - You can now create charts for stream layers. Streaming must be stopped to generate a chart.
Flicker
- Use the new Flicker mode to automatically turn layer visibility off
and on at a set interval (rate). Use it to compare raster imagery layers or any
layer changes. Flicker is an appearance setting for
feature layers in both maps and scenes but is disabled for 2D
layers in a scene. Flicker stays on until you turn it off, switch
to another view, or select a different layer. To experience flicker,
select a visible layer in the Contents pane, and on the Appearance tab. click Flicker
 .
.
Symbology
- When you symbolize polygon feature layers by unique values, graduated colors, or unclassed colors symbology, you can choose whether the color scheme is applied to the fills, the outlines, or both fills and outlines of the polygon symbols. Click the Color scheme options button
 next to the color scheme picker to choose the target for the color scheme. You can also choose the target of the color scheme when varying symbology by color.
 - You can regenerate the symbol for each symbol class to its default symbol based on current symbology parameters for unique values, graduated colors, and graduated symbols symbology. You may want to do this after you've changed the color scheme target, or after making a lot of individual symbol edits. To do this, in the Symbology pane, click the More drop-down menu and click Regenerate all symbols.
- You can refresh values in graduated colors, graduated symbols, unclassed colors, and proportional symbology if the data was updated. To do this, in the Symbology pane, click More, and click Refresh values to update the range of values.
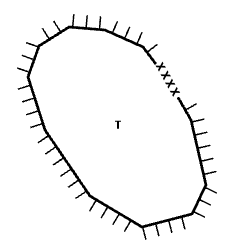
- You can specify legend patch shapes for line and polygon symbol classes. These patches are shown in the Contents pane and in legends in layouts. The following patches are available:


Line legend patch options Heat map symbology can be rendered using a constant density definition method in addition to a dynamic density definition method. With the constant method, the density definition remains constant regardless of the map extent so you can compare areas across the map at the same scale. The constant method matches the method used by ArcGIS Online.
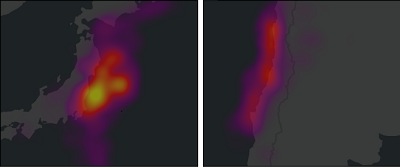
Earthquake density is compared in two areas at the same scale using constant heat map symbology. With the dynamic method, the density definition is recalculated each time the map extent changes. This method is useful to view local density variation.
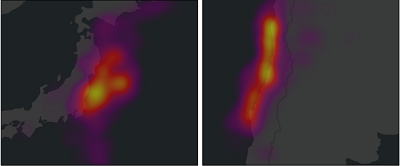
Earthquake density is compared in two areas at the same scale using dynamic heat map symbology. - The following improvements were made to dictionary symbology:
- Symbols with a status of planned, anticipated, or suspect are now dashed to match dictionary specifications.
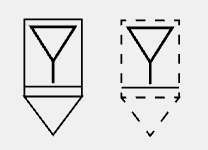
- New display configuration settings are available, including the ability to change the coloring to light, medium, or dark, and to turn the frame or the icon off.

- Echelons are now supported for lines and areas.
- Symbols with a status of planned, anticipated, or suspect are now dashed to match dictionary specifications.
- Most of the 3D point symbols in the ArcGIS Pro 3D system style now contain multiple levels of detail. When these points are drawn in a scene near the camera (in the foreground), a high-quality version of their underlying 3D model marker is used. When these points are farther from the camera (in the background of a scene) a lower quality representation is used. This substitution preserves visual quality while improving the performance of scenes containing many 3D points.
Symbol effects are supported for point symbols in 3D. The following symbol effects now honor z-values in 3D scenes:
- Enclosing polygon
- Extension
- Offset tangent
- Radial
- Suppress
Styles
- New color schemes have been added to the ArcGIS Colors system style.
- A new scientific color scheme named cividis has been added. Cividis is perceptually uniform in hue and brightness, increasing in brightness linearly. It was designed specifically for those with color vision deficiency. For more information about this color scheme, see https://journals.plos.org/plosone/article?id=10.1371/journal.pone.0199239.

The new cividis scientific color scheme is for better color blind readability. - Two variations of 16 color schemes from ArcGIS Online heat maps have been added.
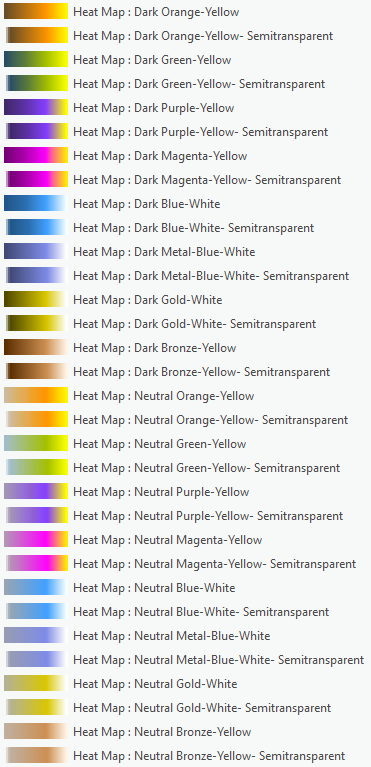
New heat map color schemes are available in solid and semitransparent variations. - Twenty-four random color schemes from ArcMap have been added to ArcGIS Colors.

New random color schemes have been added to ArcMap.
- A new scientific color scheme named cividis has been added. Cividis is perceptually uniform in hue and brightness, increasing in brightness linearly. It was designed specifically for those with color vision deficiency. For more information about this color scheme, see https://journals.plos.org/plosone/article?id=10.1371/journal.pone.0199239.
- Dimension styles are now available in ArcGIS Pro.
Layout
- Spell-check is now available for text elements in a layout. You can correct each misspelled word individually, or view all misspelled words in a layout using the Check spelling pane. Words can be added to a custom dictionary to avoid being marked as misspelled.
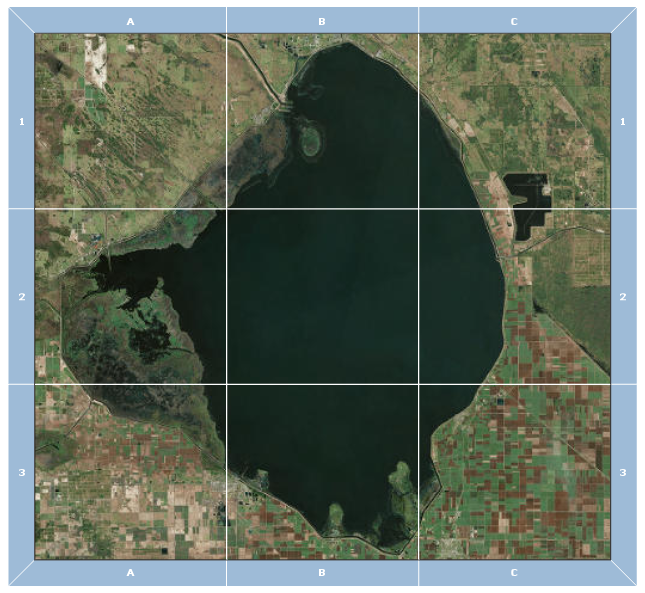
- You can add a reference grid to a map frame to divide a map into labeled, equal-area rectangles, independent of the map's coordinate system. To add a reference grid, select a map frame in the Contents pane. On the Insert tab in the Map Frames group, click Grid and select a reference grid from the gallery.
- You can specify legend patch shapes for line and polygon symbol classes. These patches are shown in legends and in the Contents pane. The following patches are available:


- The Layout SDK has been extended to support map series and export, additional events, and map frame navigation helper functions.
- Text on a layout can be displayed in columns using the Columns control in the Format Text pane. The space between columns can be set with the Column Gap control.
- The following geoprocessing tools that create and customize map series were added to the Map Series toolset:
- Calculate Adjacent Fields—Calculates values for the neighboring pages (polygon) of a grid polygon feature class.
Calculate Central Meridian and Parallels—Calculates the central meridian and optional standard parallels based on the center point of a feature's extent.
- Calculate Grid Convergence Angle—Calculates the rotation angle for true north based on the center point of each feature in a feature class.
- Calculate UTM Zone—Calculates a UTM zone based on the center point of each feature in a feature class.
- Strip Map Index Features—Creates a series of rectangular index features that follow a single linear feature or a group of linear features.
- You can now align a north arrow to magnetic north in addition to true north and map north.
Text
- You can display the Labeling Summary report by clicking More > Summary on the Labeling ribbon. The Labeling Summary report presents a general overview of the labeling classes in the map for quality assurance and performance checks. It detects potential problems with your labeling parameters that may impact labeling performance, map readability, and the ability to convert labels to annotation.
- Using the Maplex Label Engine, in addition to rotating your point labels by an attribute field, you can now rotate using an Arcade expression.
- You can create label classes from existing symbology layers. Adding label classes from symbology classes allows you to automatically create label classes for each symbology class you've defined for this layer. For example, you can label cities with a large population in a larger font than those with a smaller population.
- The Upgrade Dataset tool now accepts dimension feature classes and upgrades them to the latest release.
- You can view the layer properties for dimension layers.
- You can view the feature class properties for dimension feature classes.
- SDK for dimensions is now available. You can modify and create dimension features using the SDK.
- The Maplex Label Engine now enables alternate expressions as part of the abbreviation strategies. As with abbreviation dictionaries, alternate expressions allow the Maplex Label Engine to shorten long labels to fit in small spaces. Alternate expressions allow you to select a field to replace the longer label, or to use Arcade to build an expression with multiple fields and text.
- Labels respect the clipped shape of a map. They are redrawn so there are no clipped labels.
- Map notes include three annotation layer options—reference scales 1:1,000, 1:25,000, and 1:250,000.
- Upgraded annotation can be packaged in Mobile Map Packages.
- You can create annotation and dimension feature classes using the Create Feature Class wizard.
- Dimension styles are available in ArcGIS Pro.
- A new tool has been added to the Annotation toolset:
- Contour Annotation converts contour labels to annotation based on a line layer.
Vector tiles
- You can combine content from multiple vector tile sources into a single vector tile map layer by referencing each source in one vector tile style. This allows you to combine content from existing vector tile layers without having to create or host duplicate vector tile data for each new combination. Maintaining and combining separate vector tile layers in this way can make frequent updating of each layer more convenient.
- Support has been improved for labeling in vector tile creation including support for multiple label classes, translation style abbreviations, forced stacking, label repetition, and never-remove labels. For more information on the specific labeling properties supported, see Labeling in vector tiles.
Animation
- You can animate layer swipe effects. Select the keyframe in the Animation Timeline pane, open the Animation Properties pane, expand the Layer category, choose the layer and open its properties. Then set the swipe direction and percentage-completed—for example, Left 0%. Repeat the process for the next keyframe—for example, Left 100%—and the swipe effect will transition between the two states.
- 3D interactive analysis objects—line of sight, viewshed, view dome, and slice analysis—are now captured with your animation's keyframes. For example, create a viewshed, capture a keyframe, change the viewshed's rotation angle, and create a second keyframe. When you play the animation, the viewshed will sweep across the scene and provide feedback for visible and nonvisible areas.
Tables
- The filter indicator icons at the bottom of the table view are now clickable buttons. Table filters are used to show only those records that meet filtering criteria based on layer or extent settings. The different types of filtering include showing records that fall within the current map time (if time properties are enabled), current map range (if range properties are enabled), visible map extent, and any custom table sorting on the fields. Previously, these icons only indicated if filtering was applied. Now you can turn a filter on or off from the table view directly using these buttons.
- You can preview a tabular view of your data in the catalog view.
- The table view supports editing records that contain contingent attribute values. You can filter the table to show only those records that have contingent values defined and hide all other fields. After defining a value for one field, subsequent choices for remaining fields are reduced to promote only the valid values that meet that specification.
Measure
- The measure overlay window for maps and scenes has an improved summary of measured values and includes a net direction angle and distance value.
- Closing the Measure overlay window will exit the Measure tool, and re-activate the Explore tool.
- Geodesic measurements have improved visual feedback in global scenes.
- In-scene measurement feedback for 3D views has improved visual feedback. The dashed orange and white line indicates the direct distance between vertices. Labels for vertical offset distances and 2D distances also display, where applicable. Horizontal laser lines show comparative heights throughout the view.
Exploratory analysis
- Exploratory analysis graphics—for viewshed, line of sight, view dome, and slice—are captured when sharing a map as an image or PDF, or when printing.
Drawing and performance
3D terrain system
- Terrain skirts are removed when drawing is complete, reducing artifacts at tile boundaries for partially transparent elevation surfaces.
- Improvements have been made to the polar regions.
- Content is filled in at the poles for Web Mercator raster basemaps on globes.

A comparison of the previous version of ArcGIS Pro (left) to ArcGIS Pro 2.3 (right) is shown. - There is less degradation due to reprojection in polar areas, compared to previous versions.
- Content is filled in at the poles for Web Mercator raster basemaps on globes.
- The level of detail (LOD) selection algorithm was improved for 2D layers in scenes.
- Fewer LODs are requested for a given area.
- There is a more consistent LOD selection across a given area in a scene.
- There is higher quality display in areas of high distortion due to reprojection.
- Improvements were made to the texture compression algorithm.
- There are fewer artifacts in areas of high resampling.
- There is better color fidelity in areas where contiguous colors meet.
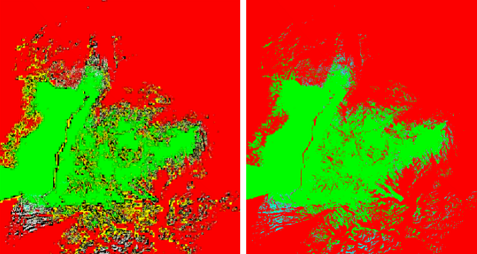
A comparison of the previous version of ArcGIS Pro (left) to ArcGIS Pro 2.3 (right) is shown.
Raster drawing
- Raster data access for drawing uses less memory.
- Performance was improved for large and compressed rasters.
- Fewer levels of detail (LODs) are requested for a given area.
- There is improved accuracy in dynamic range adjustment (DRA) calculations.
3D Rendering System
- Layers are loaded using more parallel threads, reducing overall load time.
- There is improved performance in the 3D transformation logic for billboarded markers.
- Texture loading for compatible multipatch feature services is done asynchronously, resulting in shorter wait time for initial loading.
- Transparency processing of 2D layers and 3D layers in a scene has been improved.
- The sizing of screen-sized (as opposed to real-world size) point symbols more closely match between 2D maps and 3D scenes.
- You can specify a background color in scenes (turn of stars and the halo to view it in globes).
SVG Support
- There is better support for gradients, symbols, and elements in imported SVGs.
Export
- Export of map and scene views match the aspect ratio of the view, as they did in ArcMap.
- Exporting scenes in parallel drawing mode (this viewing mode was previously named isometric) will match the display in the application more closely due to camera model improvements.
- Raster dataset appearance properties, such as gamma and brightness, are more accurately rendered in export.
- There is a new Output as Image option for all vector export formats (PDF, EPS, and SVG).
- Cancelling an export request is more responsive.
- There is improved messaging for file writing failures during export.
Analysis and geoprocessing
General
- A new memory-based workspace—memory—is supported for output feature classes and tables created by geoprocessing tools. memory feature classes and tables are stored in your system RAM, are fast to read and write, and can be used for intermediate outputs that you don't want to persist to disk or to a geodatabase. memory feature classes and tables can be added to a map. Learn more about the memory workspace.
- You can open and use multiple geoprocessing tools at the same time through a new user experience in the Geoprocessing pane. Tools can only be run one at a time. Click the Add button
 at the top of the Geoprocessing pane and click Open Another Tool to see the list of all open tools.
 - A new geoprocessing option was added that allows you to control whether output datasets created by geoprocessing are automatically added to an open map.
- A new geoprocessing option was added that allows you to control what happens to layers that have their data source overwritten by geoprocessing tools.
- You can use the Enable Undo option for certain geoprocessing tools, and use new controls available directly in the Geoprocessing pane to undo, redo, save edits, and discard edits. Learn how to undo a geoprocessing tool.
- You can track the progress of the tools you run in the Geoprocessing pane, and use the View Details and Open History options through a new user experience.
- Geoprocessing tools that add custom symbology, labeling, charts, pop-ups, and other layer properties to the output layer will have these properties automatically stored in the dataset metadata, so that if the dataset is added to another map or project, it will include the analysis result presentation.
- Geoprocessing search has been enhanced to show detailed tiles that display each tool's description and additional information through icons.
- Batch geoprocessing has been enhanced so you can add output datasets to an open map.
ModelBuilder
- You can add tools to your model by typing the name of the tool in the search text box and double-clicking the tool in the Add Tools To Model window that appears in the model window.
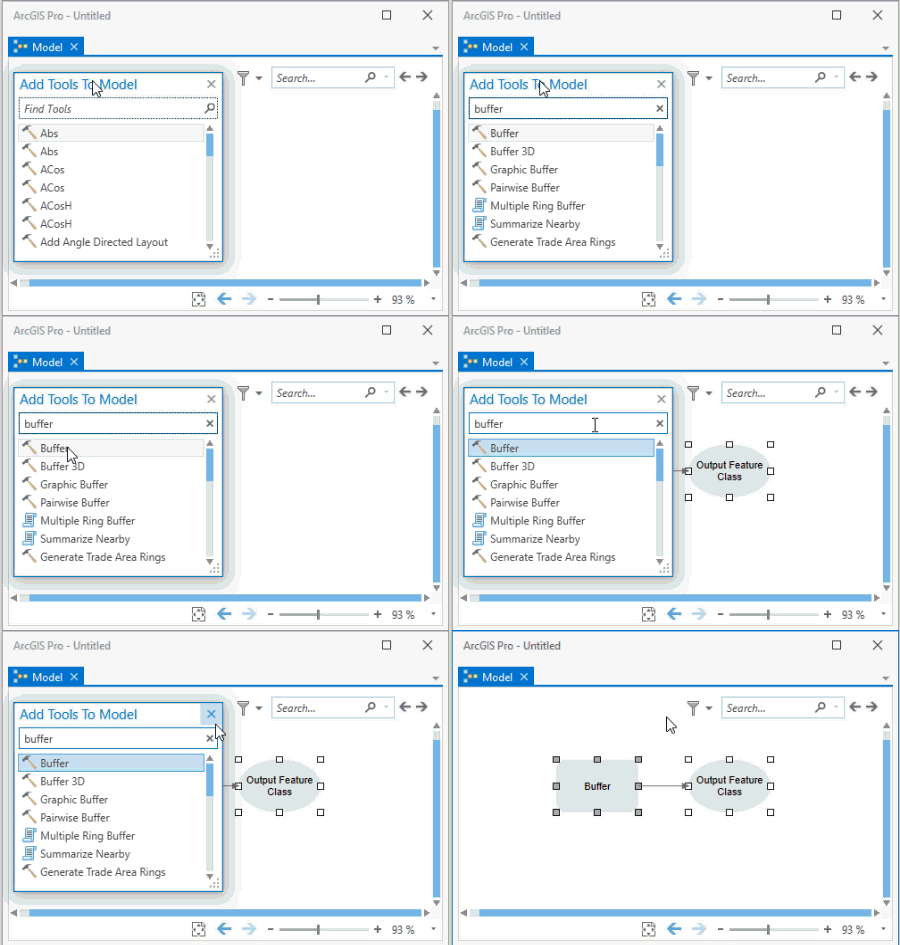
- You can add tools to your model using the new ModelBuilder > Insert > Tools menu, which allows you to search for geoprocessing tools directly from the ribbon.
- Custom model layouts and style properties that were applied in ArcMap will be maintained when the model is viewed and used in ArcGIS Pro.
- You can configure interactive feature input to your model tool by setting up a feature set variable and parameter in your model.
- The following new commands are available when you right-click in open space in your model window:
- Create Variable
- Create Label
- Validate
- Run
- Auto Layout Diagram
- Route All Links
Charts
- The List By Charts tab
 has been removed from the Contents pane. A layer's charts are now listed below the layer symbology in the Charts section. Learn more about viewing charts for a layer.
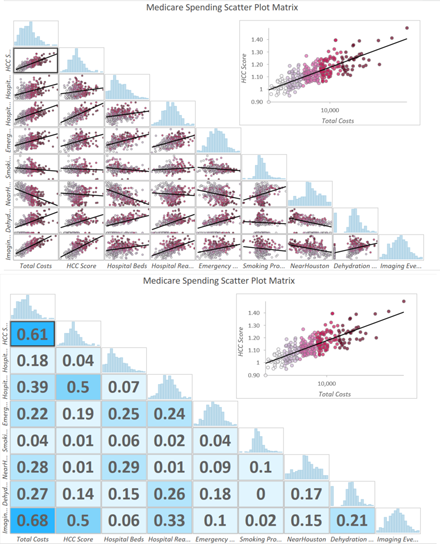
 - A new chart type, scatter plot matrix, has been added as a way to visualize bivariate relationships between combinations of multiple numeric variables.
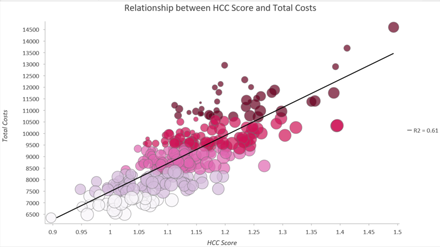
- Scatter plot points can be sized proportionally by a third numeric variable, creating a bubble plot.
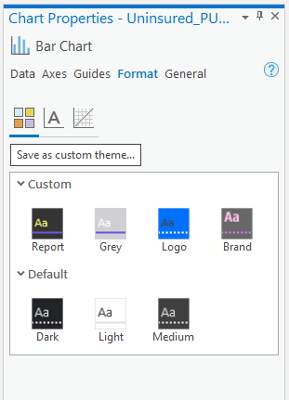
- Chart visual formatting controls have been added to the Chart Properties pane, and custom themes can be saved and applied to other charts, streamlining the formatting process.
3D Analyst toolbox
- The Sun Shadow Frequency tool has improved handling of processing extent.
New environment
- A new analysis environment setting, the Cell Size Projection Method, is available for the majority of tools in the Raster Interpolation, Math, Reclass, and Surface toolsets. This setting determines how the output raster cell size will be calculated when datasets are projected during analysis. The default method, Convert units, is equivalent to the method used in previous releases. Two additional methods, Preserve resolution and Center of extent, are now available.
Raster Surface toolset
- The Contour tool has improved performance for most polygon and polyline output.
Aviation toolbox
Tools in the Obstruction Identification Surfaces toolset have a new parameter, Custom JSON File, that imports configuration in JSON format to create custom obstruction identification surfaces (OIS).
- Import FAA 18B Shapefiles—Imports one or more FAA Advisory Circular 150/5300-18B compliant shapefiles into a geodatabase that contains the ArcGIS Aviation Airports schema.
- Export FAA 18B Shapefiles—Exports one or more FAA Advisory Circular 150/5300-18B compliant shapefiles from a geodatabase that contains the ArcGIS Aviation Airports schema.
- ICAO Annex 4—Creates obstruction identification surfaces based on the ICAO Annex 4 specification for the Precision Approach Terrain chart.
- Analyze LAS Runway Obstacles—Examines OIS with lidar-based obstacle data to determine and analyze how far the obstacles intersect OIS features.
Business Analyst
Business Analyst toolbox
- Support has been added for custom data in many Business Analyst tools. You can now define how your data is apportioned and aggregated by building an ArcGIS Statistical Data Collection (SCDX). Support was also added for ArcMap BDS Layers in the Enrich Layer tool.
- In tools that access the data browser, you can simultaneously select different types of the same demographic variable. For example, you can select a count, average, percent, and index in the same session.
- The Calculate Market Penetration tool was added to the Analysis toolset. This calculates the percent penetration based on the number of customers within an area compared to a demographic variable such as total population or total dollars. You can also set options to calculate penetration for trade areas and output a report.
- Three new tools have been added to the Trade Areas toolset.
- Generate Geographies From Overlay—Generates trade areas from the features of an input standard geography level that has a specified spatial relationship with the input.
- Generate Trade Area Rings—Creates rings around point locations and allows a remove overlapping boundary option.
- Generate Standard Geography Trade Areas—Enhanced with an expandable geography tree to more easily search for features—for example, ZIP Codes by States or Blockgroups by County by State.
- In the Suitability Analysis toolset, the Remove Suitability Criteria tool allows you to remove criteria from you analysis.
Territory Design toolbox
A major update to the Territory Design ribbon has been made, adding several popular tools. The following constraint methods have been added to the Analysis toolset. These tools control the size, shape, and distance of territories.
Set Territory Distance Parameters—Defines the type of distance calculation to use, or distance constraints to use, when creating territories.
- Territory Attribute Constraints—Sets variables for adding constraints when solving the territory solution. Territories will be constrained by minimum, maximum, or ideal value.
The following tools have also been added to the Territory Design toolbox:
- Create Territory Level Feature Classes—Creates feature classes for a specified level.
- Export Territory Solution—Exports a territory solution to a feature class. The export includes records from all levels (hierarchy) of the solution.
- Set Territory Level Options—Sets options for how territory levels are created. This tool controls the shape of each territory and whether unassigned features will be automatically assigned to the closest territory.
Cartography toolbox
- A new tool has been added to the Annotation toolset.
- Contour Annotation—Converts contour labels to annotation based on a line layer.
- Five new tools have been added to the Map Series toolset.
- Calculate Adjacent Fields—Calculates values for the neighboring pages (polygons) of a grid polygon feature class.
- Calculate Central Meridian and Parallels—Calculates the central meridian and optional standard parallels based on the center point of a feature's extent.
- Calculate Grid Convergence Angle—Calculates the rotation angle for true north based on the center point of each feature in a feature class.
- Calculate UTM Zone—Calculates a UTM zone based on the center point of each feature in a feature class.
- Strip Map Index Features—Creates a series of rectangular index features that follow a single linear feature or a group of linear features.
Conversion toolbox
- The new Convert LAS tool converts LAS files between different compression methods, file versions, and point record formats.
- The To Geodatabase toolset contains new tools, Extract Locations From Document and Extract Locations From Text, that can be used to search large blocks of text for locations and dates and combining multiple files with different coordinate formats into one feature class.
New environment
- A new analysis environment setting, the Cell Size Projection Method, is available for a number of tools in the From Raster and To Raster toolsets. This setting determines how the output raster cell size will be calculated when datasets are projected during analysis. The default method, Convert units, is equivalent to the method used in previous releases. Two additional methods, Preserve resolution and Center of extent, are now available. In the From Raster toolset, the tools are Raster to ASCII and Raster To Float. In the To Raster toolset, the tools are Feature To Raster, Multipatch to Raster, Point to Raster, Polyline to Raster, and Polygon to Raster.
Data Management toolbox
Attribute Rules toolset
The following three tools have been added:
- Alter Attribute Rule—Alters the properties of an attribute rule.
- Evaluate Rules—Evaluates geodatabase rules and functionality that are managed by services.
- Reorder Attribute Rule—Reorders the evaluation order of an attribute rule.
- The Validation rule type has been added to existing tools.
- New parameters have been added to the Add Attribute Rule tool.
Contingent Values toolset
This new toolset includes the following tools for managing geodatabase contingent values and field groups:
- Add Contingent Value—Adds a contingent value to a field group on a feature class or table.
- Alter Field Group—Alters the properties of a field group.
- Create Field Group—Creates a field group for a feature class or table.
- Delete Field Group—Deletes a field group from a table or feature class.
- Remove Contingent Value—Removes a contingent value from a field group.
Relationship Classes toolset
The following two tools have been added to manage relationship class rules:
- Add Rule to Relationship Class—Adds a rule to a relationship class.
- Remove Rule from Relationship Class—Removes a rule from a relationship class.
Sampling toolset
Two new shapes have been added to the Generate Tessellation tool: diamonds and transverse hexagons.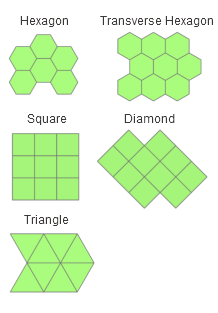
Geodatabase Administration toolset
- The Upgrade Dataset tool now accepts dimension feature classes and upgrades them to the latest release.
GeoAnalytics toolbox
The following new Feature Analysis tools are available:
- Clip Layer—Extracts input features from within specified polygons of interest.
- Dissolve Boundaries—Finds polygons that intersect or have the same field values and merges them to form a single polygon.
- Merge Layers—Combines two feature layers to create a single output layer.
Enhancements have also been made to the following tools:
- Find Point Clusters—Supports identifying clusters using the HDBSCAN algorithm.
Geostatistical Analyst toolbox
Interpolation toolset
- Empirical Bayesian Kriging 3D has been added to the list of interpolation methods. This tool allows you to perform interpolation of points that have x, y, and z coordinates as well as a measured value. The tool will predict the value at all locations between the points in 3D space. It is available as a geoprocessing tool and in the Geostatistical Wizard.
Learn more about Empirical Bayesian Kriging 3D

Working with Geostatistical Layers toolset
- A new Output elevation parameter has been added to GA Layer To Rasters and GA Layer To Contour that allows you to export 2D feature contours or rasters from Empirical Bayesian Kriging 3D. You can export at multiple elevations using batch geoprocessing, ModelBuilder, or Python.
- A new Output field parameter has been added to GA Layer To Points that allows you to predict to target points in 3D. The parameter applies to any model created by Empirical Bayesian Kriging 3D. This allows you, for example, to predict to gridded points in 3D to visualize the result of the interpolation rather than looking at individual horizontal transects.
Image Analyst
Deep Learning
The new Deep Learning toolset, which contains three new geoprocessing tools, is introduced at this release. These tools support image classification and object detection workflows that use deep learning models generated by deep learning frameworks such as TensorFlow, CNTK, and Keras.
- Create classmaps using the Classify Pixels Using Deep Learning tool that runs a trained deep learning model on an input raster to produce a classified raster. Detect Objects Using Deep Learning runs a trained deep learning model on an input raster to produce a feature class layer containing the objects it finds in imagery. Non Maximum Suppression identifies duplicate features from the output of the Detect Objects Using Deep Learning tool as a postprocessing step and creates an output with no duplicate features.
- You can install a TensorFlow deep learning framework in a cloned ArcGIS Pro environment using Conda.
Motion Imagery
A number of features and capabilities have been added that allow you to work with and analyze video data. These tools are available on the tool bar on the video player, which has been reconfigured. 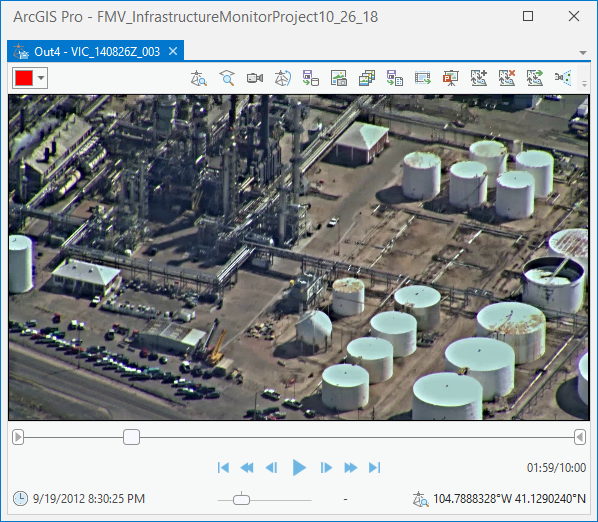
- Two new geoprocessing tools extract data from FMV-compliant video streams. The Video Metadata To Feature Class tool extracts the platform, frame center, frame outline, and attributes metadata from an FMV-compliant video, and saves the output geometry and attributes as feature classes. The Extract Video Frames To Images tool extracts and saves video frame images and associated metadata from an FMV-compliant video stream. The extracted images can be added to a mosaic dataset or other tools and functions for further analysis.
Many of the new features and tools can also be accessed from the tool bar on the Imagery tab on the main ribbon.
- You can play, analyze, and work with live video streams in real time. To play a live video stream, you need either the User Datagram Protocol (UDP) or Real Time Streaming Protocol (RTSP) address of the video stream.
- Sync Graphics allows you to display feature class layers in the map in archived or live stream videos. You can create or edit feature classes in the video player and work with the updated content on the map bidirectionally.
- The Export to PowerPoint tool exports the video frame data to a PowerPoint presentation. The video frame image, footprint, sensor ground track, and all associated metadata is exported to the PowerPoint presentation report.
- Synchronize the map time extent to the video to show all the features with timestamps that match the current video timestamp. This allows you to query features from time-aware layers both spatially and temporally for features that intersect with the video footprint and display in the video player.
- Record metadata as the video plays to feature classes or a CSV (commas separated by value) file.
- Interactively extract video frames from live stream and archived videos as the video plays, and save them as images.
- Expand the video player to full screen mode by pressing the F11 key. This allows you to quickly perform video analysis operations.
- Display the same coordinates in the map and the video player window. This functionality converts the video coordinates—in pixel columns and rows—to map coordinates in real time.
- Configure your video project workspace by defining your default geodatabase and folders to save exported metadata files, images, PowerPoint presentations, and video clips for your project.
Neighborhood toolset
- The Focal Statistics tool now supports the Parallel Processing Factor environment. The tool uses multiple processors when calculating statistics of the output raster for improved performance.
Segmentation and Classification toolset
- The Deep Learning Model to ECD tool has been deprecated at this release. The conversion from deep learning model to ArcGIS Pro classification capability is accommodated in the deep learning inference tools Detect Objects Using Deep Learning and Classify Pixels Using Deep Learning in the ArcGIS Image Analyst Deep Learning toolset.
New environments
- A new analysis environment setting, Cell Size Projection Method, is available for a number of Image Analyst tools. This setting determines how the output raster cell size will be calculated when datasets are projected during analysis. The default method, Convert units, is equivalent to the method used in previous releases. Two additional methods, Preserve resolution and Center of extent, are now available. This environment is available for tools in the Map Algebra, Math, Overlay, and Statistical toolsets.
- The new Processor Type environment setting specifies whether to process data using CPU or GPU.
- The new GPU ID environment setting identifies the GPU to use to process your data.
Maritime toolbox
- A new version of S-101 Feature Catalogue, S-101FC_1.0.0_20180918_esri_spatial_association, is supported.
Multidimension toolbox
- The Make NetCDF Raster Layer and Make OPeNDAP Raster Layer tools have a new parameter, Cell Registration that controls how the cells are registered with respect to the XY coordinates.
- The Make NetCDF Table View tool now has null in the output table view to represent missing_value or _FillValue attributes of a variable in a netCDF file.
Network Analyst
- The addition (+) and subtraction (-) operators have been added to the Function evaluator. These operators can be used when you're setting up a function evaluator on a network dataset.
- Descriptor, Time Zone, and Hierarchy attributes can now be configured on a network dataset in ArcGIS Pro.
- You can make a copy of Cost and Restriction attributes using the copy functionality that can be accessed from the Options button
 in the upper right corner of the Network Dataset Properties dialog box.
 - The Source Settings page on the Network Dataset Properties dialog box has three tabs: Source, Vertical Connectivity, and Group Connectivity. On these tabs, you can add or remove the data sources that can participate in the network and also establish vertical and group connectivity between the source features.
- If your network dataset is configured to use traffic, you can visualize and edit the traffic configuration on your network dataset using the Historical and Live traffic tabs.
- The GetWebToolInfo function has been added to arcpy.na. Using this function, you can retrieve input data limits and other information about ArcGIS Online or portal service tools.
- The arcpy.na.GetTravelModes function accepts the portal URL as the path of a network dataset.
- The arcpy.na.CheckIntersectionFeatures function supports Feature Sets and String data types.
Raster Analysis toolbox
Deep Learning toolset
The new Deep Learning toolset, which contains two new geoprocessing tools, is introduced at this release. These tools support image classification and object detection workflows that use deep learning models generated by deep learning frameworks such as TensorFlow, CNTK, and Keras.
- Create classmaps using the Classify Pixels Using Deep Learning tool that runs a trained deep learning model on an input raster to produce a classified raster.
- Detect Objects Using Deep Learning runs a trained deep learning model on an input raster to produce a feature class layer containing the objects it finds in imagery. It includes the Non Maximum Suppression parameter that identifies and removes any duplicate feature objects.
Hydrology toolset
- The Flow Distance tool has a new parameter, Statistics type, that determines the statistics type used to compute flow distance over multiple flow paths.
Spatial Analyst toolbox
New environment
A new analysis environment setting, Cell Size Projection Method, is available for a number of Spatial Analyst tools. This setting determines how the output raster cell size will be calculated when datasets are projected during analysis. The default method, Convert units, is equivalent to the method used in previous releases. Two additional methods, Preserve resolution and Center of extent, are now available. Check the list of supported environments for a particular tool to determine if it is available.
Extraction toolset
- The Extract Multi Values to Points, Extract Values to Points, and Sample tools have been re-engineered for better performance. The interpolation methods have also been improved for these tools.
- Image services of multidimensional data are now supported in the Sample tool.
Hydrology toolset
- The Flow Distance tool has a new parameter Statistics type that determines the statistics type used to compute flow distance over multiple flow paths.
Neighborhood toolset
- The Focal Statistics tool now supports the Parallel Processing Factor environment. The tool uses multiple processors when calculating statistics of the output raster for improved performance.
Reclass toolset
- The Reclassify tool has improved stability of the remap control.
Segmentation and Classification toolset
- The Deep Learning Model to ECD tool has been deprecated at this release.
Surface toolset
- The Contour tool has improved performance for most polygon and polyline output.
Spatial Statistics toolbox
Two new tools have been added to the Modeling Spatial Relationships toolset.
Generalized Linear Regression (GLR) is a suite of regression models that allow you to quantify relationships between a dependent variable of interest and any number of explanatory variables. Optionally, you can predict values of the dependent variable. GLR includes the functionality of the previously available Ordinary Least Squares (OLS) regression tool and adds two additional model types, logistic and Poisson.
- Geographically Weighted Regression (GWR) is a local form of regression that can be used to model spatially varying relationships in your study area. This tool provides a local model of the variable or process you are trying to understand or predict by fitting a regression equation to every feature in the dataset, allowing you to inspect how the model and relationships may change across your study area. GWR also supports OLS, logistic, and Poisson model types.
- Enhancements to the Forest-based Classification and Regression tool have been made including additional diagnostics, model validation options, and performance improvements.
WFS support
- You can use reserved keywords to set connection properties at the WFS service connection level instead of per layer. For example, you can specify a BBOX value that allows you to limit the number of features returned to the geographic area specified.
- You can view or modify the properties of a WFS server connection by right-clicking the connection and selecting Properties.
Python
- The Python Package Manager was upgraded and supports cloning to any folder location, adding new environments from other locations, and improved reporting of invalid environments.
- The arcpy.ImportCredentials function can be used to import credential information from GIS Server connection files to allow access to ArcGIS Server secured services.
- The version of Python in ArcGIS Pro was upgraded to Python 3.6.6.
Data management
General
- Attribute rules have been enhanced with additional rule types and a new view to improve the user experience when working with attribute rules. For new Arcade functionality, see the ArcGIS Arcade version 1.5 release notes.
- The Attribute Rules view provides access to view, create, and manage attribute rules on datasets.
- Several new tools are available to work with attribute rules in the Attribute Rules toolset. See the What's new section for the Data management toolbox and history to review new tools and changes to existing tools.
- Batch Calculation and Validation rules are new rule types that allow you to evaluate rules on existing features. These rules are evaluated at a user-specified time using the Error Inspector or the Evaluate Rules tool. For more information, see Evaluate attribute rules.
- Contingent attribute values are a new data design feature that allow you to make values in one field dependent on values in another. They use domains and the concept of field groups to create a set of fields and a list of valid values for those fields. You can set dependencies on field values where if Field A is set to a specific value, it constrains the valid values for Field B. For example, if a field for power pole materials is set to Wood, the valid values for the height field for that pole are restricted to 35, 40, and 45 feet. If the field is instead set to Steel, the valid values for the height field are 45, 50, and 55 feet. These types of dependencies between your fields can be set up using contingent values.
- The new Transfer Files tool efficiently transfers files between a file system and a cloud storage workspace.
- The new arcpy.da.ListContingentValues function lists the contingent values in a table.
- You can retrieve the properties of field groups using the arcpy.Describe().fieldGroups function.
- You can retrieve the properties of relationship class rules using the arcpy.Describe().relationshipRules function.
Enterprise geodatabases and databases
- You can no longer create user-schema geodatabases in Oracle. You can continue to use and upgrade existing user-schema geodatabases at this release, but you should begin moving your data to stand-alone geodatabases.
- The use of Altibase databases with ArcGIS has been deprecated.
- You cannot create a geodatabase in Microsoft SQL Server 2012 or upgrade an existing geodatabase if it resides in a SQL Server 2012 database.
Edit data
- Dimension construction tools are now available with feature templates for dimension layers. To learn more, see Create dimension features and Modify a dimension.
- When you create two-point COGO-enabled lines, editing constraints for direction and distance such as Dynamic Constraints, now write the values typed into these tools to the appropriate COGO fields. When Ground to Grid is turned on, grid corrected values are written to the fields.
- Replace Sketch
 is available on the context menu when you create polyline or polygon features. This tool replaces your unfinished sketch with the geometry of the topmost visible feature you right-click on a map.
To learn more, see
Replace sketch geometry.
 - Midpoint
 is available on the construction toolbar when you create line or polygon features. This tool creates a vertex midway between two consecutive points you click on a map. When using this tool with other construction tools, the active sketch is suspended until the vertex is added and a segment from the previous vertex is drawn. To learn more,
see Create a vertex between two locations.
 - Streaming
 is available on the construction toolbar and the context menu when you create polyline or polygon features. This tool creates a free hand sketch by streaming vertices and then simplifies the sketch into a series of line segments within a specified tolerance. To learn more, see Create segments by streaming vertices.
 - Utility network associations appear on the Template Properties dialog box for group templates when the primary template creates utility network features. To learn more, see Utility Network reference for editing.
- Pressing the T key shows the vertices of the feature near the pointer when you sketch a feature or modify a feature using a tool that creates a sketch to split or reshape a feature.
The following is available on the Edit tab:
- Ground to Grid
 settings are now available on the Edit tab, in the Corrections group. Ground to grid corrections manage how and when direction and distance values for new geometry are interpreted as ground survey measurements and converted to grid values. To learn more, see Turn ground to grid corrections on or off.
The following are available in the Modify Features pane:
- Divide
 hosts tools for dividing polyline and polygon features by a value. To learn more about dividing a polygon feature into proportional areas, equal areas, or equal widths, see Divide a polygon by a value. To learn more about dividing a polyline feature by distances, number of parts, or a percentage, see Divide a polyline by a value.
 - Fillet
 creates a circular arc that is tangent between two segments and trims or extends the two connecting segments. You can drag and size the radius dynamically or type a fixed radial distance. To learn more, see Create a fillet between two segments.
 - Generalize
 can reduce the complexity of a line or a polygon feature while
retaining its basic shape.
To learn more, see
Generalize a feature.
 - Split
 now includes a By Feature tab. This tab allows you to select one or more input features and use them to split one or more selected target features. To learn more, see Split a feature.
The following are available in the Create Features pane:
- Change Length
 is available on the context menu when you use any tool that uses a sketched line to create or modify a feature. To learn more, see
Trim or extend an unfinished line.
- Follow Feature
 is available with feature templates for annotation layers. This tool creates text parallel to line segments of an existing polyline or polygon feature. To learn more, see Create annotation features.
Metadata
- You can create metadata to describe the purpose and contents of an ArcGIS Pro project. When the catalog view is active, click Project in the Contents pane to see and edit the current project's metadata.
Data Reviewer
Reviewer rules
- Attribute rule integration
Many of the Data Reviewer automated validation methods (checks) can be configured as attribute rules. Attribute rules are user-defined rules that can be configured to enforce data integrity while editing. The following Data Reviewer checks are now configurable as a constraint rules:
- Cutbacks—Finds segments where the angle between segments in a polygon or polyline is below a specified minimum value.
- Duplicate Vertex—Finds vertices in polyline and polygon features that are within a user-specified tolerance.
- Evaluate Part Count—Finds features with a part count that is within a specified value.
- Evaluate Polygon Perimeter and Area—Finds parts, segments, or entire polygons for features whose area or perimeter is within a specified range.
- Evaluate Polyline Length—Finds polyline segments, parts, or features that have a line length within a specified tolerance.
- Evaluate Vertex Count—Finds polyline or polygon features that have a vertex count within a specified tolerance.
- Feature on Feature—Finds features that have a specific relationship, either from two feature layers or within the same feature layer.
- Monotonicity—Searches z- or m-enabled polylines for vertices that are not strictly increasing or decreasing in value or are trending based on specified conditions.
- Polyline or Path Closes on Self—Finds paths or lines in polyline features that close themselves.
- ArcGIS Workflow Manager (Classic) integration
Delete Reviewer Session is a new custom step available for use with the ArcGIS Workflow Manager (Classic) extension. This new step, when used in conjunction with the Create Reviewer Session step, enables the automatic deletion of Reviewer sessions associated with a job. This can include removing all or a user-specified set of sessions. For more information, see Data Reviewer custom steps and tokens.
Reviewer batch jobs
The Polyline or Path Closes on Self check has been updated to only find features or their individual paths that close on themselves. Use the Invalid Geometry check, which was updated at the ArcGIS Pro 2.3 and ArcGIS Data Reviewer 10.6 releases, to find polylines that contain self-intersecting paths.
Geocoding
- The new Create Locator tool creates locators that do the following:
- Support suggestions when used locally in ArcGIS Pro.
- Return suggestions with verified house numbers.
- Extend support for more intersection geocoding
cases, such as logical intersections where two street segments do
not actually intersect. For example, a
street ending in a cul-de-sac or dead end may
be close to a cross street but separated from it by a walkway. A
highway overpass is elevated above the road beneath it, so they
cross each other but aren't connected.

- Include enhancements to reverse geocoding to return matches to the
most relevant feature (point or polygon) near your location, which
may be an address, point of interest, or postal code.
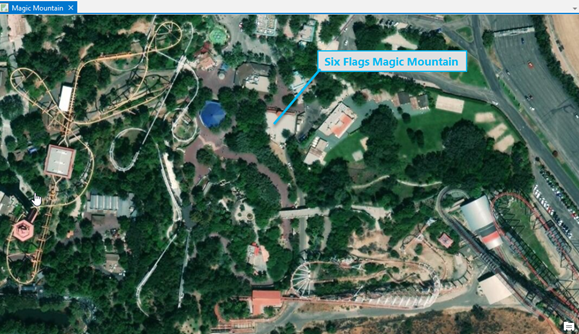
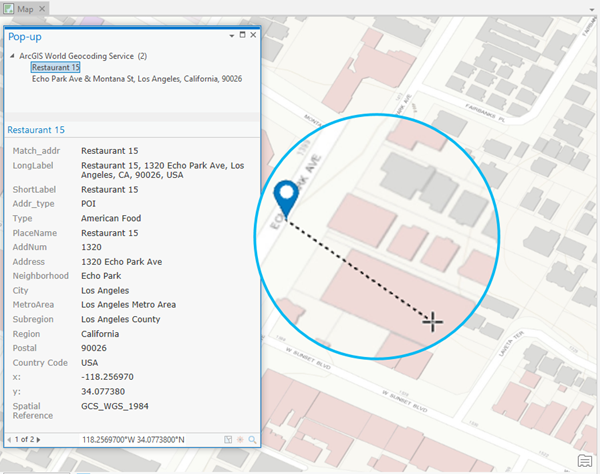
- You can now see where you clicked on the map and where the match result comes from when using What's here to reverse geocode or identify locations on the map.
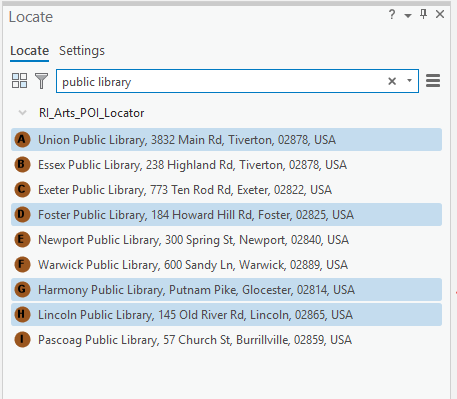
- When you search for features or addresses in the Locate pane, you can now select multiple result candidates and view the details for all of the selected candidates in the Pop-up window. You can also add the selected candidates as selected features in the layers that were searched.
Imagery and raster
General
Access your files and data in cloud stores by adding a cloud storage connection to your project available in the Cloud Stores category in the Catalog pane and the catalog view.
Ortho Mapping
Prepare your drone, aerial, and scanned photograph ortho mapping workspaces for block adjustment with the new Build Frames & Cameras Tables tool. This tool provides a dialog box where you populate the camera table and frame table schema information, and compute interior orientation information. By providing your camera model and basic information, the affine transformation is automatically computed to support block adjustment. If you move or copy the source data and tables for your ortho mapping project, there is no need to modify the camera and frames tables.
Geoprocessing Tools
To support more efficient and timely display and processing of mosaic datasets that reference rasters on cloud or slow Network Attached Storage (NAS), the capability to generate and manage pixel cache has been added. The cache is stored on the local machine to improve performance.
- The Enable Pixel Cache parameter has been added to the Add Rasters to Mosaic Dataset tool. This specifies whether the pixel cache will be generated.
- The new Clear Pixel Cache tool deletes the pixel cache associated with a mosaic dataset.
New Raster Functions
The following raster functions have been added at this release:
- Corridor—Calculates the sum of accumulative costs for two input accumulative cost rasters.
- Focal Statistics—Calculates, for each input cell location, a statistic of the values within a specified neighborhood around it.
- Lookup—Creates a raster by looking up values found in another field in the table of the input raster.
- Path Allocation—Calculates the least-cost source for each cell based on the least accumulative cost over a cost surface, while accounting for surface distance along with horizontal and vertical cost factors.
- Path Distance—Calculates, for each cell, the least accumulative cost distance from or to the least-cost source, while accounting for surface distance along with horizontal and vertical cost factors.
- Path Distance Back Link—Defines the neighbor that is the next cell on the least accumulative cost path to the least-cost source, while accounting for surface distance along with horizontal and vertical cost factors.
- Region Group—Determines, for each input cell, the identity of the connected region to which that cell belongs.
Raster Function Enhancements
- The Flow Distance function has a new parameter, Statistics Type, that determines the statistics type used to compute flow distance over multiple flow paths.
LocateXT
The LocateXT extension is now available for ArcGIS Pro. You can scan unstructured documents such as text files, Microsoft Word documents, and PowerPoint presentations, and create points representing geographic coordinates or place names that were found in those documents. Dates and other information can be extracted from the documents and recorded in the attribute table.
You can perform this analysis interactively with the Extract Locations pane, which can be opened from the Add Data drop-down menu. Two geoprocessing tools are also available in the Conversion toolbox in the To Geodatabase toolset to automate this work: Extract Locations From Documents and Extract Locations From Text.
Production
Airports
- Line and polygon support for the Terrain and Obstacle Profile element is now available through the Generate OIS Profile Data and Generate OIS Obstacle Data geoprocessing tools.
- Use the Custom JSON File option in the CustomizeOIS.exe file that is part of the ArcGIS Aviation data package available at My Esri to create a custom file.
For more information, see the tools in the Obstruction Identification Surfaces toolset.
Defense Mapping
- The Slope Guide surround element has been added to Defense Mapping.
The new Workflow toolset has been added to the Topographic Production toolbox. This toolset contains geoprocessing tools used for automating production workflows as follows:
- Set Data Workspace—Automates workflows so that steps execute in the correct data workspace.
- Set Production Properties—Determines the correct default extended property settings associated with a selected production type in the production workflow environment so that associated tasks are executed using the correct configuration details.
- Update Property Count—Updates an extended property value by one each time a workflow step is executed so that metrics are recorded.
- Create Job For Task—Automatically creates or updates a Workflow Manager job for a task.
- Insert Task Group—Adds tasks to a workflow as determined by workflow execution
- Set Next Task—Sets the next task in a workflow from the task list.
- Set Task List—Determines the correct tasks associated with the selected task group in the production workflow environment to execute the correct tasks in the correct order.
- Set Task Status—Automatically executes configuration tasks with a Workflow Manager job in an automated production workflow.
The following geoprocessing tools have been added to the Cartographic Refinement toolset:
- Apply Masks From Rules—Applies masking to feature layers in the map based on the XML rule file and mask features created by the Make Mask From Rules tool.
- Apply Visual Specification To Map—Applies representation symbology to existing data based on attribute rules defined in an SQL statement.
- Make Masks From Rules—Creates polygon masks for features based on color rules.
The following geoprocessing tools have been added to the Generalization toolset:
- Export Generalized Data—Exports generalized data created by generalization models back into a production schema using generalization rules defined in a Microsoft Excel spreadsheet.
- Import Generalization Data—Imports data from an optimized generalization geodatabase to a themed generalization database using generalization rules defined in a Microsoft Excel spreadsheet.
The following geoprocessing tools include an additional parameter that compares touching polygon features with the input features and generalizes those features that are smaller than the specified area:
- Identify Narrow Polygons—The new connecting_features parameter compares touching polygon features to the Input Features and adds those that are smaller than the Minimum Area with the input features.
- Polygon To Centerline—The new connecting_features parameter compares touching polygon features to the Input Features and adds those that are smaller than the Minimum Area with the input features.
Pipeline Referencing
- Service-based network editing—You can now perform network editing using a linear referencing-enabled feature service. When a service is published with the Linear Referencing and Version Management Service capabilities enabled and you add them to a map in ArcGIS Pro, the LRS data from the layers in the service can be used for editing with the tools on the Location Referencing ribbon. For more information on getting started with service based editing in Pipeline Referencing, see Share as web layers with linear referencing and version management.
- Service-based support for geoprocessing tools—Location Referencing toolbox geoprocessing tools now support input data from a feature service with the Linear Referencing and Version Management Service capabilities enabled. This allows you to execute these tools with the same service used for network editing. For more information on the tools that support using layers from a service as the input, see Location Referencing toolbox branch versioning support.
- Conflict prevention for network editing—Conflict prevention is now supported for LRS Network editing in ArcGIS Pro. The conflict prevention process allow a user to select a route for exclusive use within their version. Once this route is associated with the user who selects it, only they can make changes to the route until they post their changes to the Default version in the geodatabase or delete their version with the edits. This ensures that no other user can make changes to the route while the user with exclusive use is editing. For more information, see Conflict prevention.
- The following are new tools in the Location Referencing toolbox:
- Generate Calibration Points—Creates calibration points with the correct location, Measure, routeID, From Date, To Date, and NetworkID for each route in the selected calibration feature class.
- Remove Overlapping Centerlines—Ensures that there is only one centerline in cases where the centerline geometry overlaps.
Production Mapping
The new Workflow toolset has been added to the Topographic Production toolbox. This toolset contains the following geoprocessing tools used for automating production workflows:
- Set Data Workspace—Automates workflows so that steps execute in the correct data workspace.
- Set Production Properties—Determines the correct default extended property settings associated with a selected production type in the production workflow environment so that associated tasks are executed using the correct configuration details.
- Update Property Count—Updates an extended property value by one each time a workflow step is executed so that metrics are recorded.
- Create Job For Task—Automatically creates or updates a Workflow Manager job for a task.
- Insert Task Group—Adds tasks to a workflow as determined by workflow execution
- Set Next Task—Sets the next task in a workflow from the task list.
- Set Task List—Determines the correct tasks associated with the selected task group in the production workflow environment to execute the correct tasks in the correct order.
- Set Task Status—Automatically executes configuration tasks with a Workflow Manager job in an automated production workflow.
The following geoprocessing tools have been added to the Cartographic Refinement toolset:
- Apply Masks From Rules—Applies masking to feature layers in the map based on the XML rule file and mask features created by the Make Mask From Rules tool.
- Apply Visual Specification To Map—Applies representation symbology to existing data based on attribute rules defined in an SQL statement.
- Make Masks From Rules—Creates polygon masks for features based on color rules.
The following geoprocessing tools have been added to the Generalization toolset:
- Export Generalized Data—Exports generalized data created by generalization models back into a production schema using generalization rules defined in a Microsoft Excel spreadsheet.
- Import Generalization Data—Imports data from an optimized generalization geodatabase to a themed generalization database using generalization rules defined in a Microsoft Excel spreadsheet.
The following geoprocessing tools include an additional parameter that compares touching polygon features with the input features and generalizes those features that are smaller than the specified area:
- Identify Narrow Polygons—The new connecting_features parameter compares touching polygon features to the Input Features and adds those that are smaller than the Minimum Area with the input features.
- Polygon To Centerline—The new connecting_features parameter compares touching polygon features to the Input Features and adds those that are smaller than the Minimum Area with the input features.
Utility network
- The network properties are accessible from the Catalog pane using a database connection. This is helpful when you are configuring the utility network and have direct access to the geodatabase via a database connection.
- The Utility Network Data tab is automatically available when there is a utility network layer in the active map view.
- You can make changes to terminal connections when accessing a utility network in an unversioned state via a database connection. This is helpful for the initial data validation process and can be used in conjunction with enabling the network topology to discover errors.
- The Last Update Is Connected Time property is included in the network properties. This provides a date and timestamp when the Update Is Connected tool was last executed for a utility network.
- A new Isolation trace type is available for the Trace tool. This is helpful to isolate an area of a network by determining the minimum set of operable features required to stop a network's resource. See Locate isolating features for more information.
- The Export Subnetwork tool has been enhanced to include more details about the subnetwork that can optionally be included in the JSON export file. Export formats for feature elements, geometry, field values, network attributes, subnetwork controllers, and connectivity are now included. See Export subnetwork information for more information.
Network diagrams
- Two new diagram rules can now be added to your diagram templates by running the Add Spatial Query Rule and Add Set Starting Point By Attribute Rule tools.
- The Spatial Query rule can be used to detect new utility network features based on their location relative to utility network features that currently exist in the diagram, and append these detected features to the network diagram.
- The Set Starting Point rule is used to preset features represented in the diagram as starting points.
- The Add Collapse Container Rule, Add Collapse Container By Attribute Rule, and Add Reduce Edge By Attribute Rule tools have been updated to support a new option, Aggregate reconnected edges. This option allows you to specify whether the rule will aggregate the edges that are reconnected to the collapsed or reduced junctions.
- A new diagram algorithm layout, Relative Mainline, has been developed to arrange network diagram features in diagrams along parallel straight lines for which all the connected edges have the same attribute value. This layout can be executed on a network diagram by running Apply Relative Mainline Layout and added to diagram templates by running Add Relative Mainline Layout.
- The Reshape Diagram Edges Layout geoprocessing tool has been extended to support a new reshape operation, Mark crossing edges. When running the layout algorithm with this new operation, the algorithm layout detects the horizontal and vertical diagram edges that cross each other at right angles and reshapes one of the crossing edge's geometry to display a circular arc at this location.
- The new geoprocessing tool, Export Diagram Content, can be used to export diagram content in a simple format (.json file) that reflects basic connectivity. It allows you to export a diagram's content into a simple format that can be used for network calculation, analysis, or to feed external systems.
Work more efficiently
Application user interface
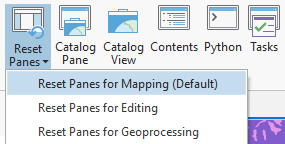
- The new Reset Panes command allows you to reset the application to a predefined group of panes. This is useful for specific tasks and clearing up the application window. For example, Reset Panes for Geoprocessing closes all open panes and reopens only the Contents, Catalog, and Geoprocessing panes, with the Geoprocessing pane in the foreground.
Catalog view
The catalog view has been improved to support more effective project and data management as follows:
- You can browse project containers, collections in the active portal, and favorites in the Contents pane. Items that are containers—including maps, databases, folders, toolboxes, servers, and portal groups—are listed. Select and manage individual items in the catalog view's contents list.
- When you browse a folder, you can browse the contents of database and server connections in that folder without adding those connections to the project first.
- You can preview the data in a table or the attribute table associated with spatial data.
- The Catalog tab on the ribbon allows you to manage items in your current location, including copying, pasting, deleting, and renaming items that support these operations. You can add items to the project or to favorites. You can repair project items, or remove items from the project. You can create new items that can be stored in the current location, add existing items to the project such as a file geodatabase, or import items such as an ArcMap document.
- Some project containers have a contextual tab on the ribbon that provides additional options for managing those items. For example, when you click Styles in the Contents pane, the Styles contextual tab appears under the Manage heading on the ribbon.
Workflow Manager
- The following enhancements have been made to the job summary area of the job view:
- Job Notes has been updated to allow you to quickly identify when a job contains job notes. Jobs that don't contain job notes display an Add Job Notes button
 , and jobs with job notes display a View And Edit Job Notes button
  . For more information on job notes, see Add, view, and edit job notes.
 - Step Percentage is a new option that allows you to define the progress of a step's completion as a percentage value.
- Job Notes has been updated to allow you to quickly identify when a job contains job notes. Jobs that don't contain job notes display an Add Job Notes button
- The Workflow pane has been updated to include a new Step Percentage option that allows you to define the progress of a step's completion as a percentage value.
Share your work
- Web feature layers that reference registered data can now include upgraded dimensions. For more information on upgrading dimension feature classes, see Upgrade dataset.
- The following additional support for OGC services have been added:
- WFS can be configured when sharing a map image layer to ArcGIS Enterprise 10.7 or a web feature layer to ArcGIS Enterprise 10.5 or later.
- WCS can be configured when sharing a map image layer to ArcGIS Enterprise 10.7.
- WMS properties are now configurable when sharing a map image layer.
KML and Validation capabilities can be enabled when sharing a map image layer to ArcGIS Enterprise 10.7.
- Ground elevation sources are published as web elevation layers when sharing a web scene to ArcGIS Online.
- Building layers can be shared as web scene layers to ArcGIS Online and ArcGIS Enterprise 10.7.
When sharing a project package or project template, geoprocessing history items and custom toolboxes can optionally be excluded.
The arcpy.sharing module supports publishing map services to a stand-alone ArcGIS Server using Python.
Extend ArcGIS Pro
- The ArcGIS Pro SDK for Microsoft .NET allows you to extend ArcGIS Pro with your own unique tools and workflows using SDK add-ins and configurations.
